Cluster Overview
Navigation
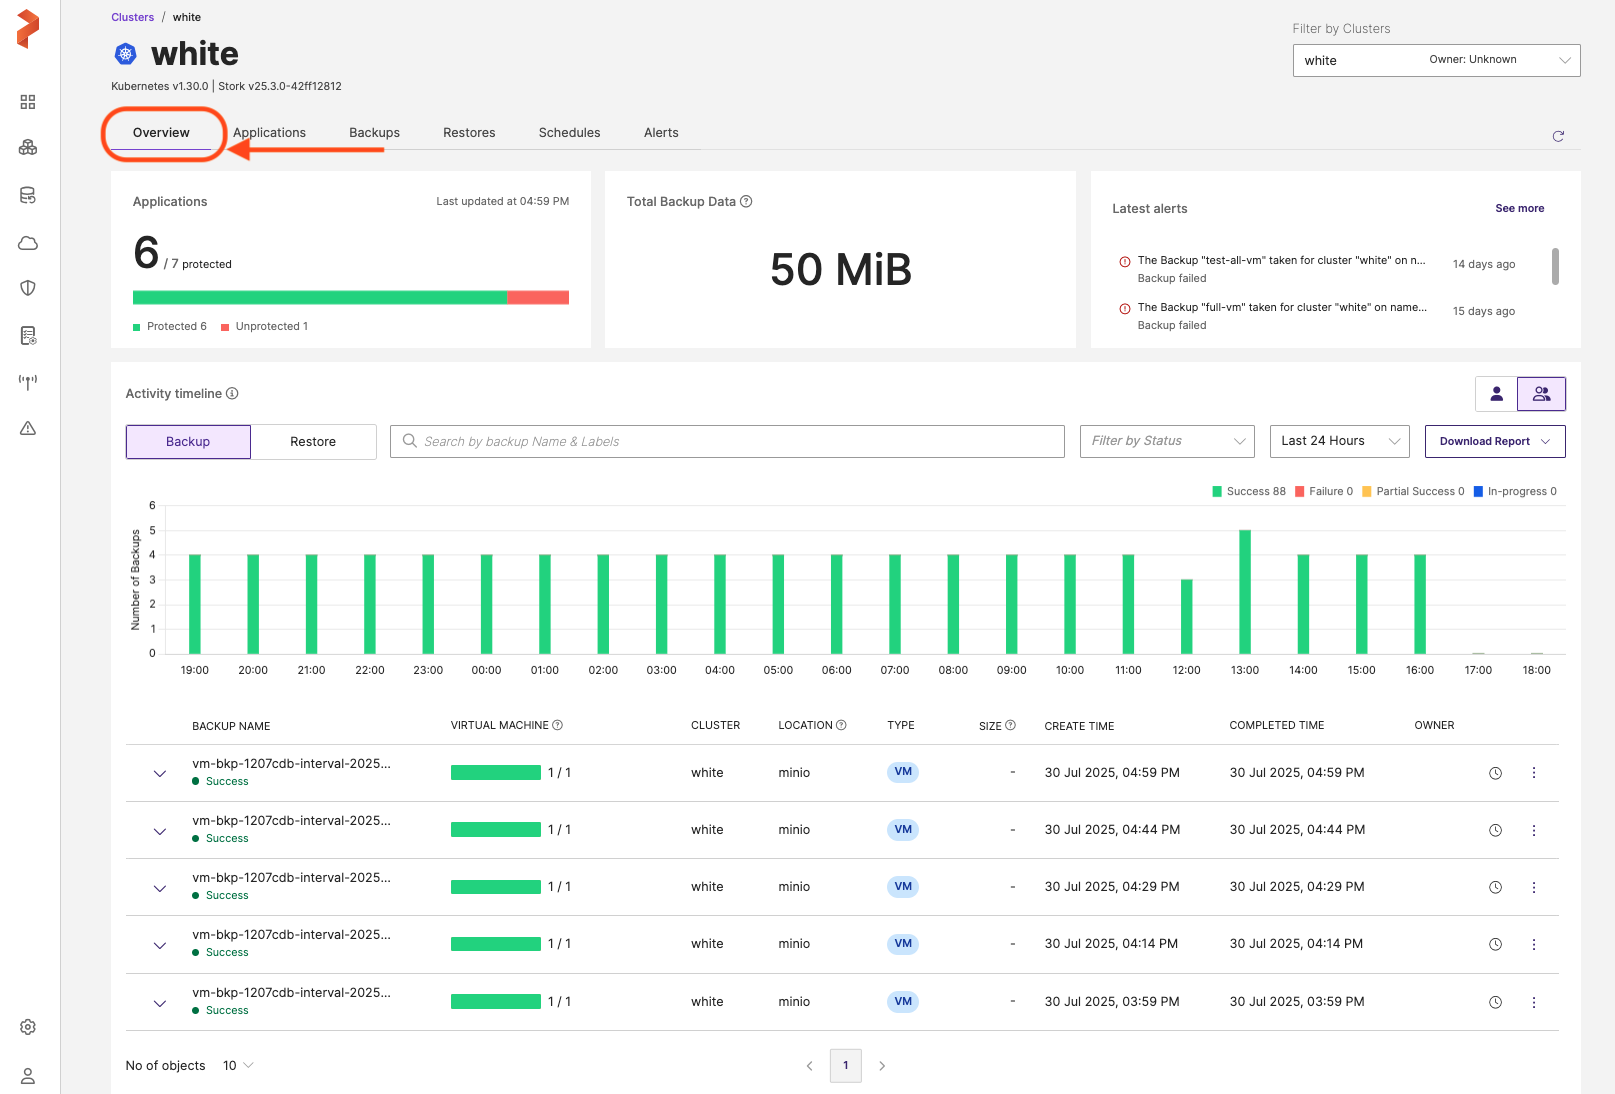
Home page → Left navigation pane → Clusters → (cluster-name) → Overview
Page Overview
The cluster Overview page provides a high-level snapshot of the backup health and protection status of applications across the selected Kubernetes cluster. It serves as a centralized dashboard where users can quickly assess the effectiveness of their backup strategy and identify areas that need attention.
Page Components
The key components of this page are as follows:
-
Clusters/(cluster-name): a cluster breadcrumb to indicate that you are viewing a specific cluster called (cluster-name).
-
Filter by Clusters: A drop-down that allows you to choose the required cluster. To view dashboard data (protected applications, total backup data, latest alerts, and activity timeline) of a specific cluster, you need to choose the required cluster from this drop-down. This drop-down lists the first 200 application clusters added to PXB. You can also quickly search the required cluster by its name.
-
Top Navigation Tabs
-
Overview: displays general information pertaining to the chosen Kubernetes cluster
-
Applications: displays the namespaces and VMs that are on the selected Kubernetes cluster, you can back up your applications from this tab
-
Backups: shows the namespace and VM backups you have created along with the status of the backup, you can restore the backups you have created from here
-
Restores: helps you to manage and view your restore operations
-
Schedules: you can view the schedules associated with your backups here along with its status and other details
-
Alerts: view alerts related to this cluster
Dashboard components
-
Applications: displays the application protection status, shows the total number of applications with the breakdown of protected vs unprotected applications across the chosen cluster. Web console auto-refreshes this data frequently to fetch the latest data.
-
Protected: the number of applications of the chosen cluster that are currently backed up and hence protected
-
Unprotected: the number of applications belonging to the selected cluster that you are yet to back up
noteIf you have backed up a namespace with Partial Success state, that namespace will be listed as protected.
-
-
Total Backup Data: this widget shows the cumulative size of all backup data of chosen Kubernetes cluster
-
Latest alerts: a panel that displays system-generated alerts and displays the recent five alerts
To view the alerts associated with all the clusters or specific clusters, from the left navigation pane:
-
Click Alerts icon from the left navigation pane, and the Alerts page appears. You can search the alert by its name or filter by alert type or clusters
OR
-
Click Clusters icon in the left navigation pane, choose the required cluster and then move to Alerts tab from the top tab view.
-
-
Activity timeline: this component is further classified into Activity timeline chart and Activity timeline table and holds the following components:
-
User icons: Two icons on the extreme right, helps you to switch between:
-
My cluster activity timeline: activity timeline displays data of backups and restores owned by you.
-
All users activity timeline: here activity timeline displays backup and restore data owned by other users
-
-
Backup: this tab displays the details of all the backups of various applications you have created across the selected Kubernetes cluster
-
Restore: this tab allows you to view the restore details of applications across selected Kubernetes cluster
The following options/fields are common to both Backup and Restore tab:
-
Search by Backup/Restore name Labels: a search box which allows you to search a backup by its name
-
Filter by Status: filter by status field helps to shortlist the backups or restores with the following status:
- In-Progress
- Success
- Failed
- Deleting
- Delete pending
- Partial success
-
Time Filter (Last 24 hours): a drop-down that shows the backup or restore status data by time created
- Last 24 hours
- Last 1 week
- Last 1 month
- Custom
-
Download report: a drop-down that allows you to download backup or restore report either in:
- PDF format
- CSV format
noteIf your report contains incomplete data, please check and adjust the date range to ensure completeness.
-
Activity timeline chart: displays a bar graph representation of backups/restores along with their status. Hovering over the individual bar graph displays the number of backups/restores associated with the selected bar.
noteActivity timeline chart displays backups and restores that are in the following states for the logged-in user:
- Success
- Failed
- In-Progress
- Partial Success Backups and restores in Deleting and Delete pending state are not taken into account for here.
-
Backup Tab
-
Activity timeline table for backup: displays specific details of backups spread across multiple backup locations and namespaces in tabular format. Lists individual backup activities with the following details:
-
BACKUP NAME: the unique identifier for the backup. You can sort this column either by ascending or descending order of backup name by clicking on the arrows at the end of the column name. When the data is not sorted, web console always displays the latest record first.
-
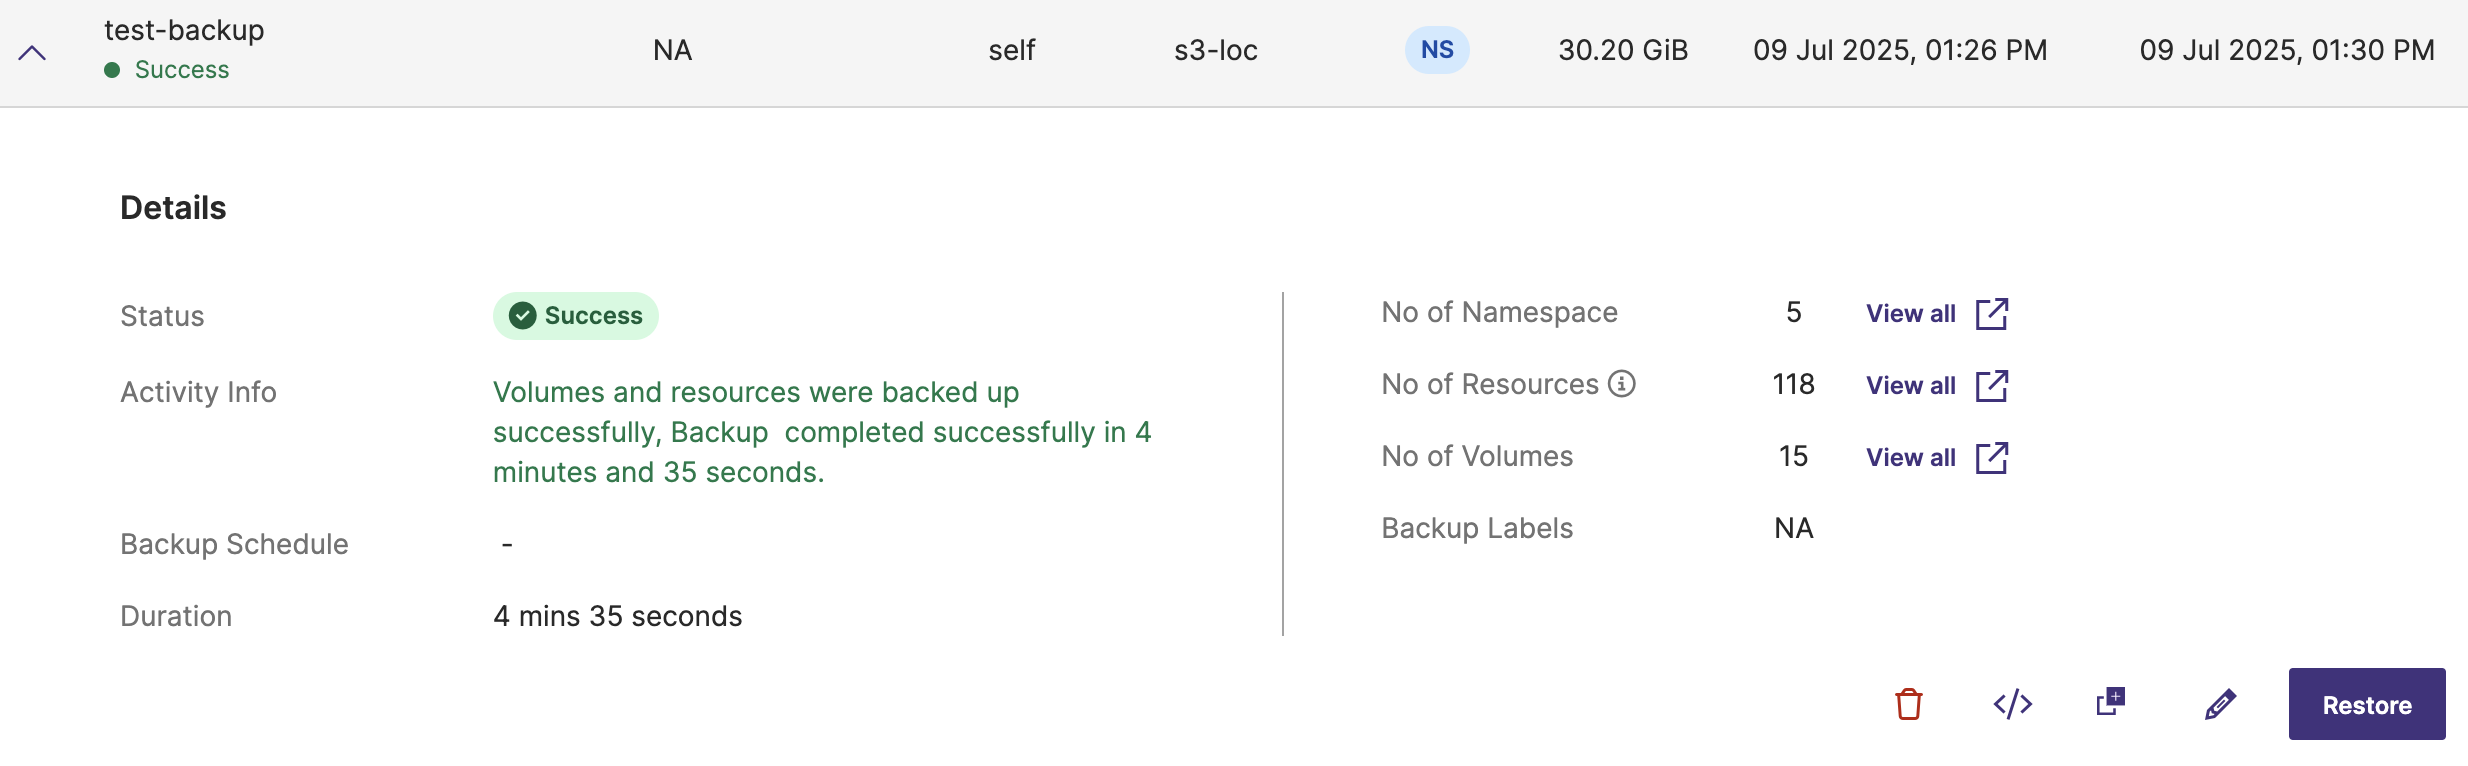
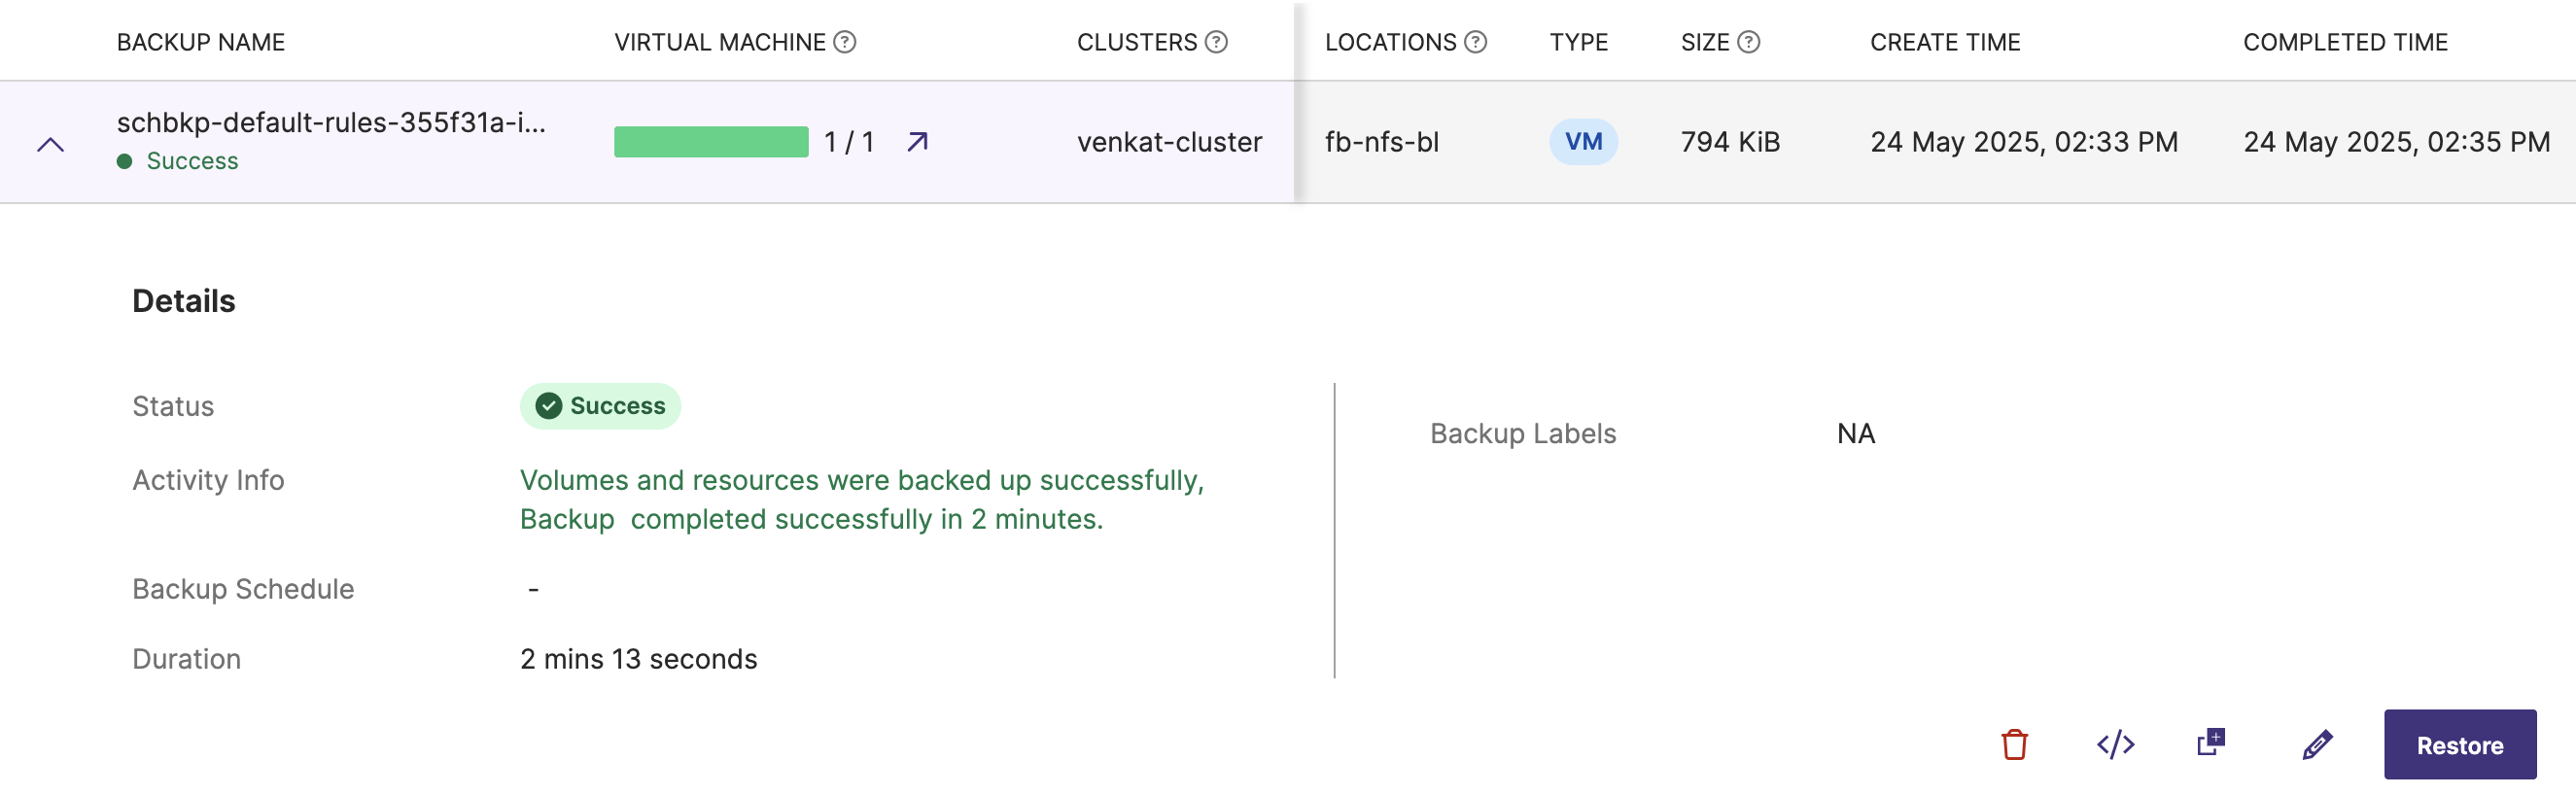
Details: an expandable arrow to give more information on the backup such as status, activity information, backup schedules, upcoming schedules, retention period information, number of namespaces/VMs, resources, and volumes backed up in namespace or VM backup.
You can click View All to view all the namespaces/VMs, resources and volumes associated with the backup. Besides, it gives options to delete, view Json, duplicate, edit and restore the backup.
- Namespace backup details:
- VM backup details:
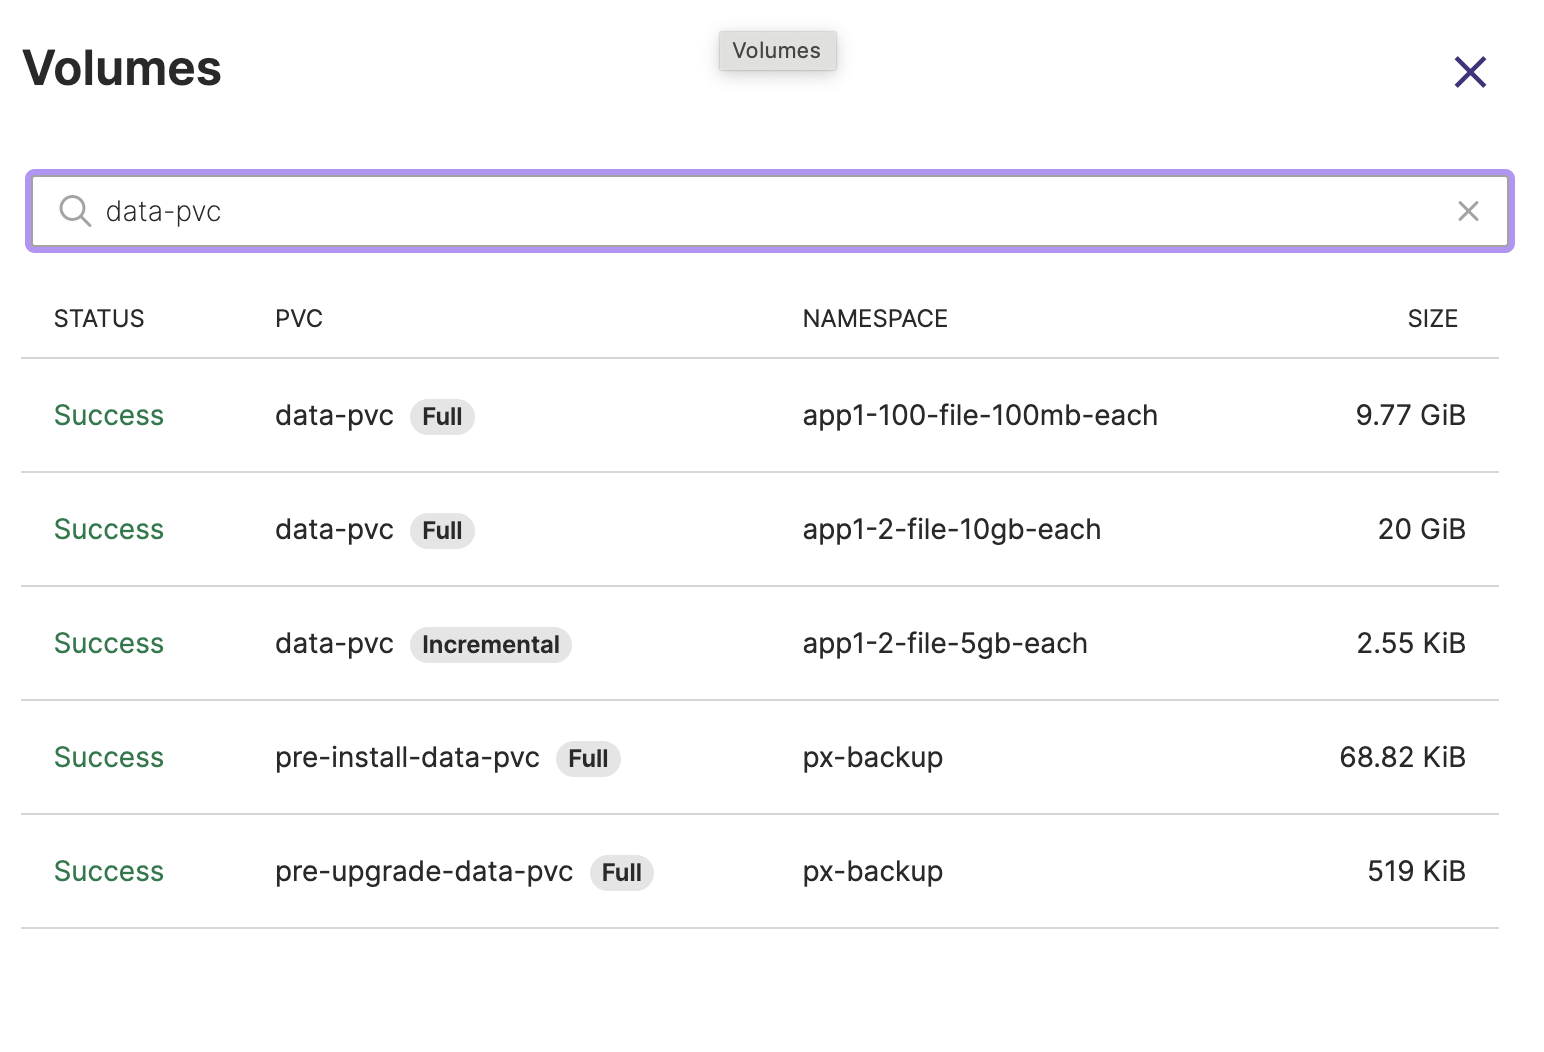
To learn if PVCs of Portworx volumes are Full or Incremental, you can click View all for No of volumes as shown here:
 note
noteIf an application is being backed up for the first time, a Full backup is created. Subsequent backups are Incremental, capturing only the changes since the last successful backup.
noteRetention period information is visible only for AWS object lock enabled backup and for backups with Azure immutability support.
-
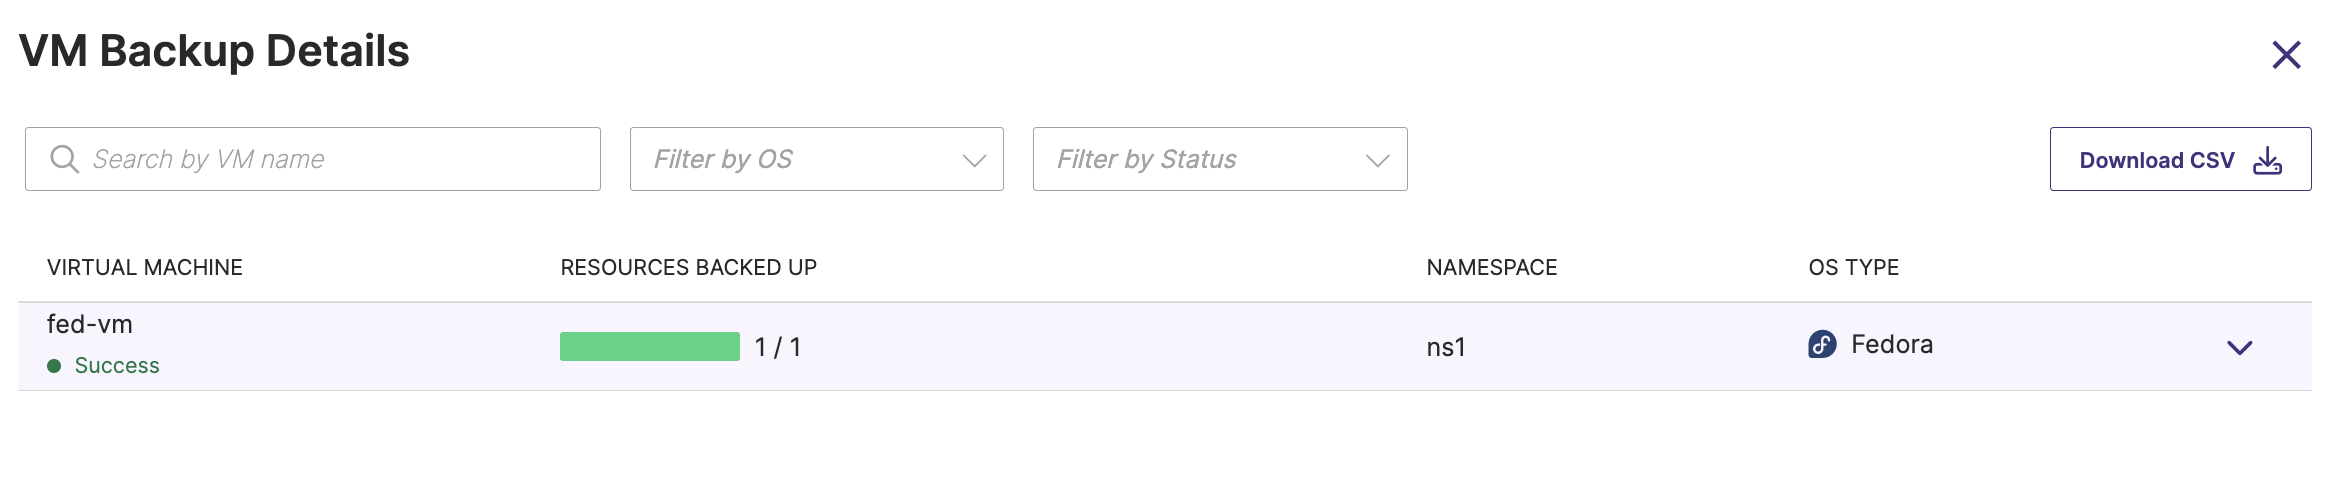
VIRTUAL MACHINE: displays progress bar for VM backups and NA for namespace backups. For VM backups:
-
When VM backup is in progress: displays the progress bar on how many VMs are backed up and how many are still pending
-
When backup is complete: displays a green completion bar along with the number of VMs that are backed up
-
Partial success backup: displays a mix of green and red bar indicating the number of successfully backed up VMs out of total number of VMs selected for backup
-
Failed backups: displays a red bar with zero out of total number of VMs selected for the backup
-
Arrow: displays an arrow when you hover over the values of this column. Clicking the arrow displays the following window that provides more information about a specific VM backup:
-
-
CLUSTER: cluster from where that backup is created. You can sort this column either by ascending or descending order of cluster name by clicking on the arrows at the end of the column name. When the data is not sorted, web console always displays the latest record first.
-
LOCATION: where the backup is stored
-
TYPE: displays NS or VM based on the backup type
-
SIZE: the size of the backup. You can sort this column either by ascending or descending order of backup size by clicking on the arrows at the beginning of the column name. When the data is not sorted, web console always displays the latest record first.
-
CREATE TIME: the timestamp when the backup was started. You can sort this column either by ascending or descending order of backup creation time by clicking on the arrows at the end of the column name. When the data is not sorted, web console always displays the latest record first.
-
COMPLETED TIME: the timestamp when the backup was completed
-
OWNER: log-in name of the user who initiated the backup
-
Clock icon and/or lock icon: a small clock icon after timestamp indicates that the backup is a scheduled backup. A lock icon indicates that backup is an object lock enabled backup.
-
Vertical ellipsis: provides options to restore the backup, view json details, show backup details, edit the backup to apply labels, duplicate the backup, retry option for a partially successful or failed backups, and to completely delete the backup.
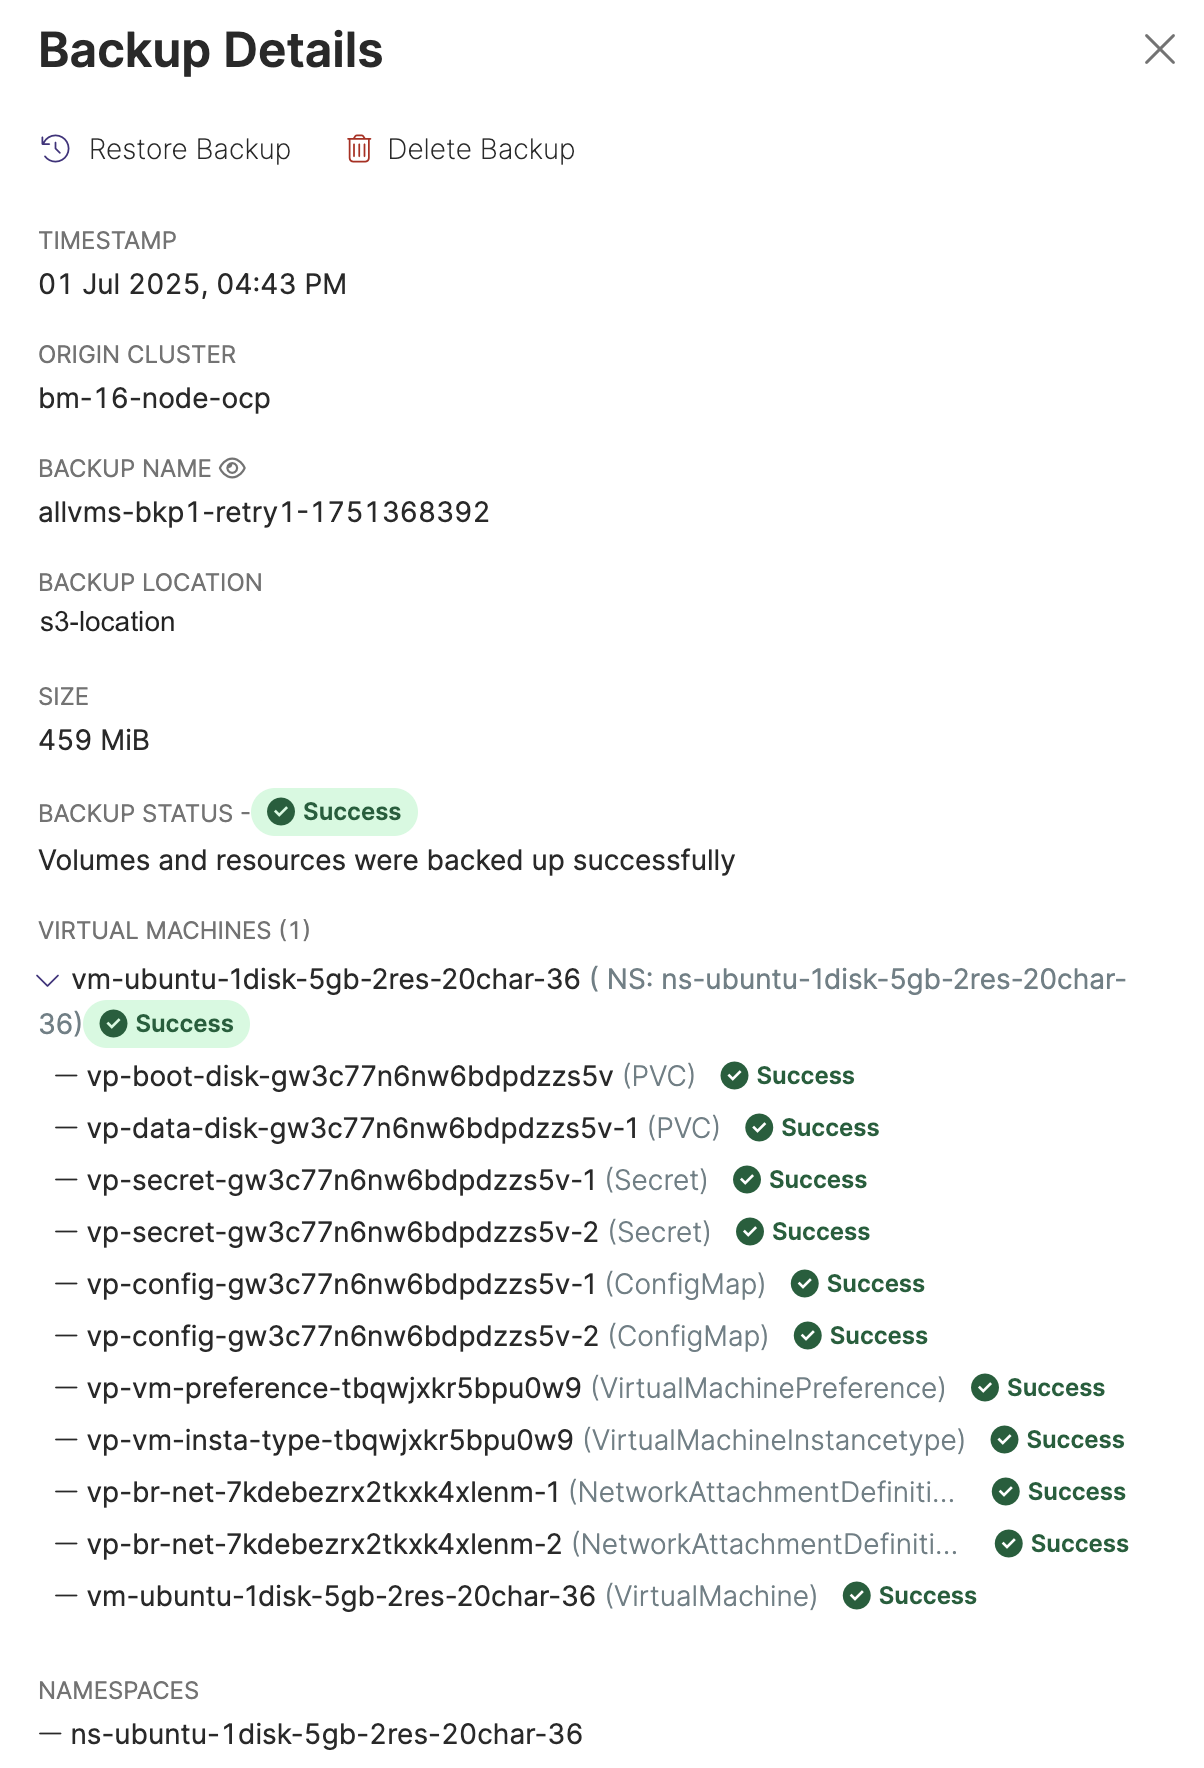
For VM backups, the Show Details option displays granular details of the VMs, the associated PVCs, resources and the namespaces linked with the VMs as shown below. For large resource backups, Show Details window displays only the PVCs associated with the VMs but not the resources.
-
Restore Tab
-
Activity timeline table for restore: displays specific details of and restores spread across multiple backup locations and namespaces in tabular format. Lists individual backup/restore activities with the following details:
-
RESTORE NAME: the unique identifier for the backup. You can sort this column either by ascending or descending order of restore name by clicking on the arrows at the end of the column name. When the data is not sorted, web console always displays the latest record first.
-
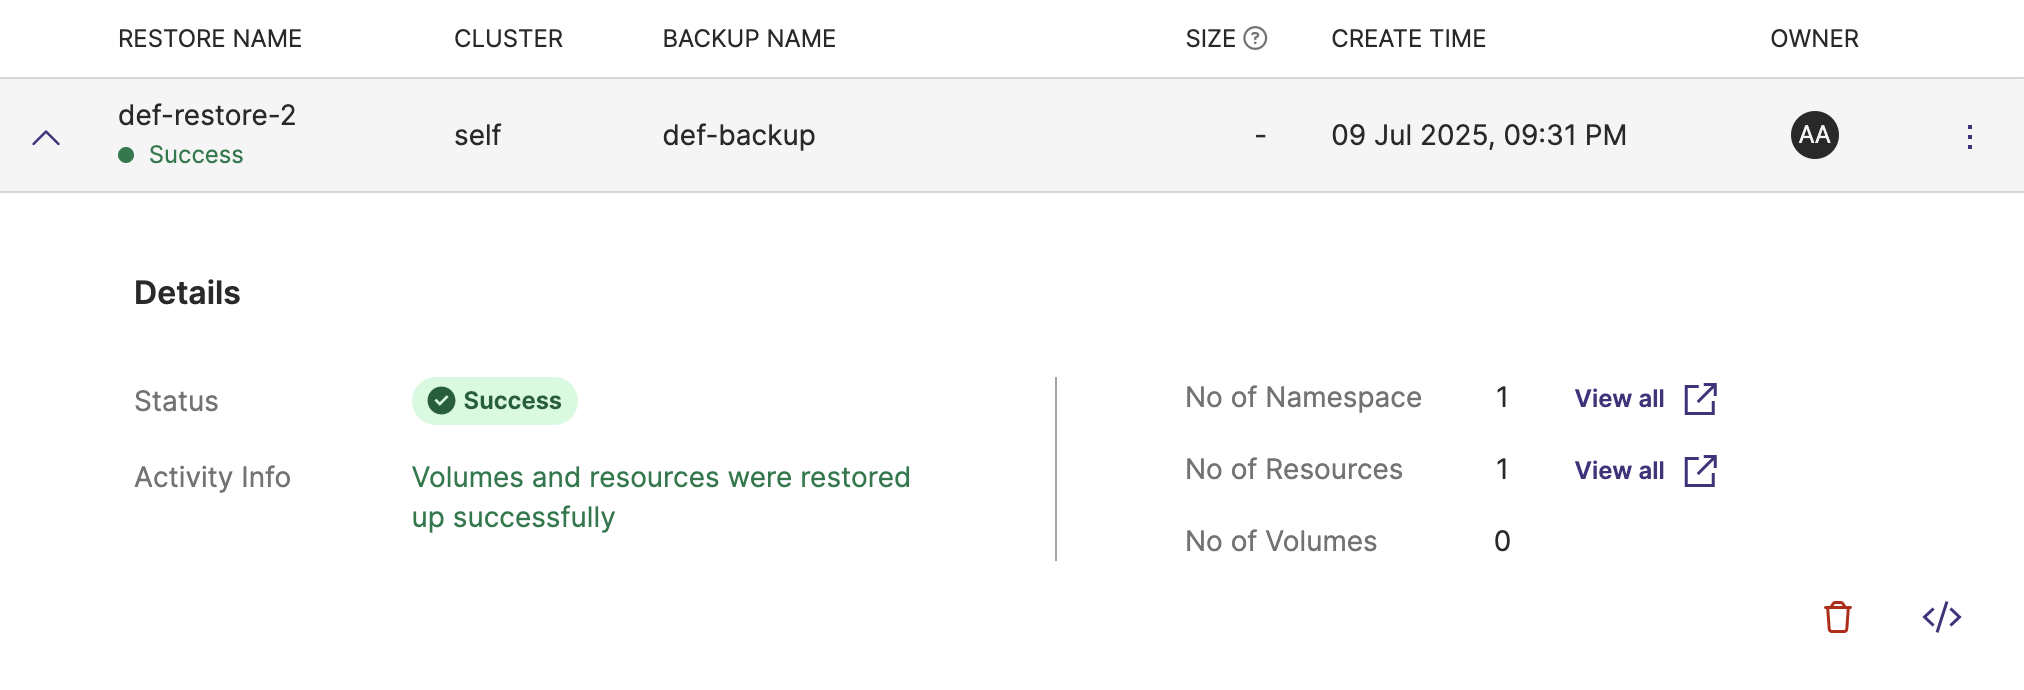
Details: an expand more arrow that gives more information on the restore such as status, activity info, schedule associated with the restore and so on.
-
CLUSTER: the cluster to which restore belongs to. You can sort this column either by ascending or descending order of cluster name by clicking on the arrows at the end of the column name. When the data is not sorted, web console always displays the latest record first.
-
BACKUP NAME: name of the backup utilized to create the restore. You can sort this column either by ascending or descending order of backup name by clicking on the arrows at the end of the column name. When the data is not sorted, web console always displays the latest record first.
-
TYPE: type of backup (NS or VM)
-
SIZE: the size of the restore. You can sort this column either by ascending or descending order of backup size by clicking on the arrows at the beginning of the column name. When the data is not sorted, web console always displays the latest record first.
-
CREATE TIME: the timestamp when the restore was created. You can sort this column either by ascending or descending order of backup creation time by clicking on the arrows at the end of the column name. When the data is not sorted, web console always displays the latest record first.
-
OWNER: log-in name of the user who initiated the restore
-
Vertical ellipsis: provides options to view json details, show restore details, duplicate the restore, and to completely remove the restore
noteIf there is no backup/restore created, activity timeline chart/table remains blank without any data.
noteIf you are on OCP cluster and if you see any data loss in activity timeline table or chart, refer OCP configuration for troubleshooting information.
-
-
Pagination: navigational controls to move through different pages of the Activity timeline.
-
Error alerts: displays a red bar in the top-right corner of the page to indicate that there is an issue to be troubleshooted
-
Notification alerts: a green bar appears in the top-right corner to notify that the task (adding cloud account, adding backup location, creating a backup, restoring a backup and so on) is successful
Filter by status and time combination
-
In the backup tab, if you select In-Progress option from Filter by status drop-down and choose Last 24 hours from the time filter drop-down, the activity timeline chart/table displays the number of backups that are in in-progress state out of the backups you triggered in the last 24 hours. For example, if you created 10 backups in the last 24 hours out of which 4 backups are in in-progress state the activity timeline chart/table displays only 4 backups along with their details.
-
In the restore tab, if you select Partial success option from Filter by status and choose Last one month from the time filter drop-down, the activity timeline chart/table displays the number of restores that are in partial success state from past one month. In other words, if you have created 26 restores in last one month out of which 3 restores are in partial success state, active timeline table/chart displays only 3 restores and their details.