Alerts
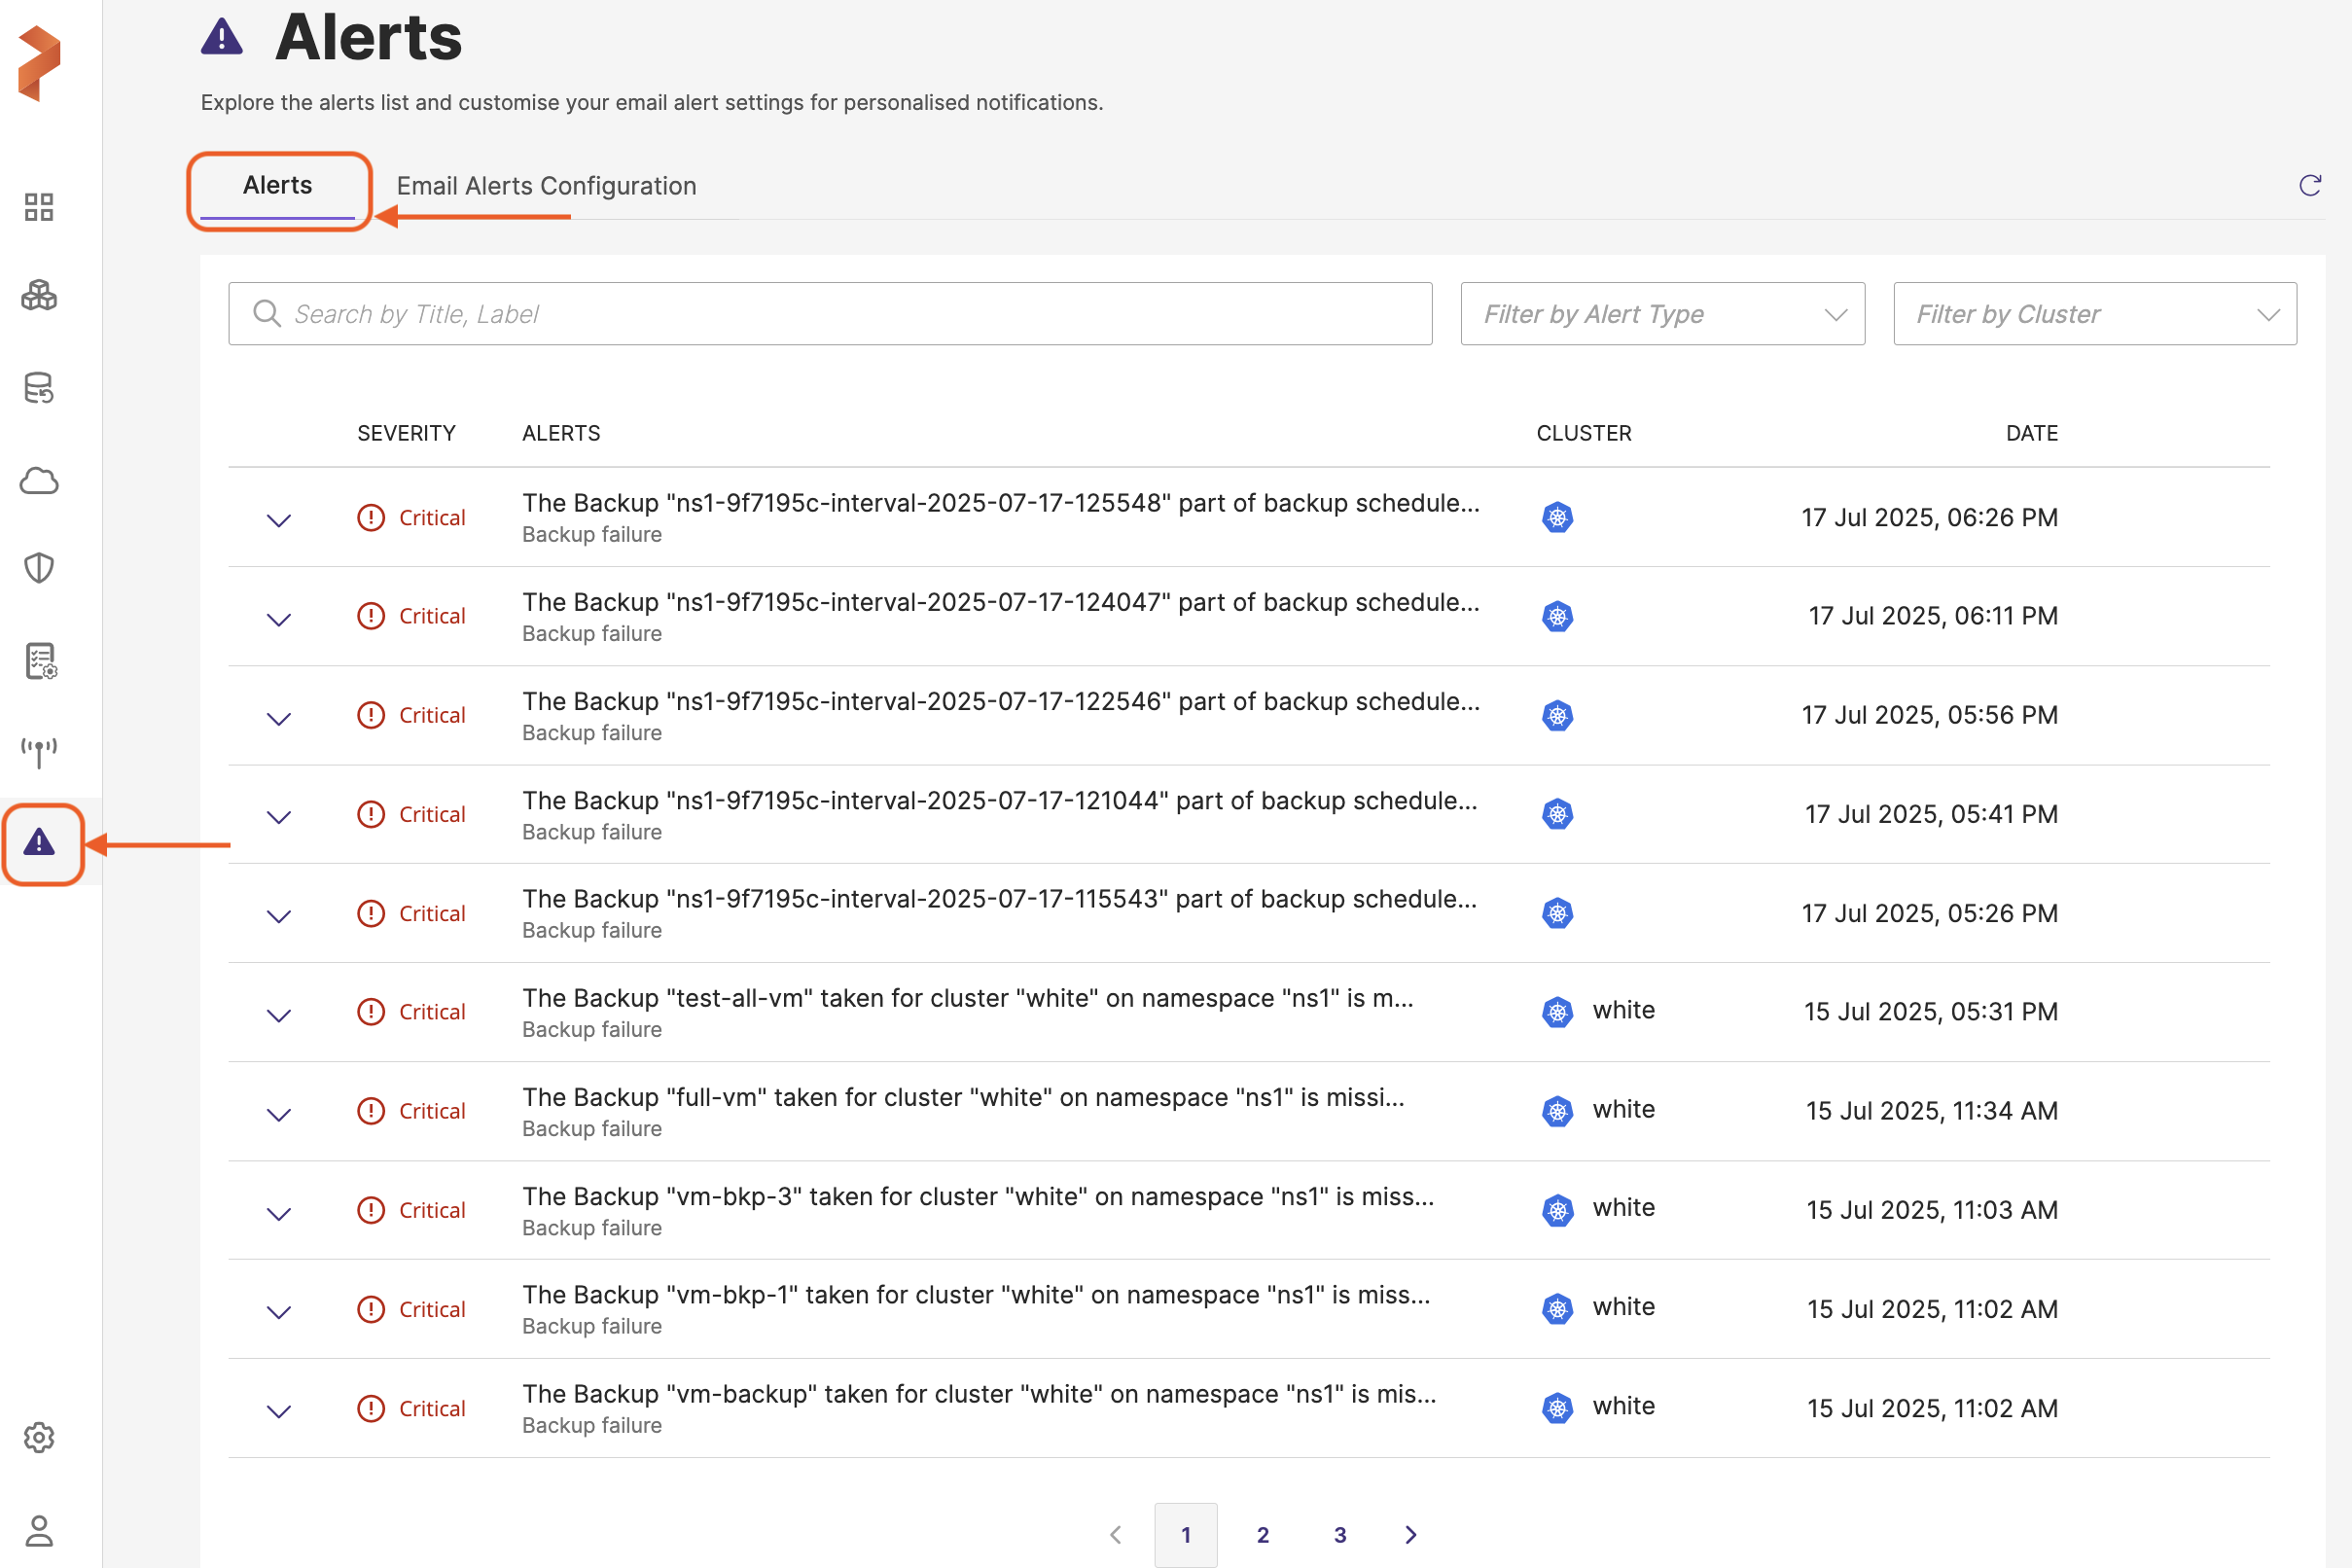
The Alerts page allows you to manage the alerts of severity level critical from a backup application or service. Following list explains the various components of the Alerts page.
Portworx Backup generates alerts for the following critical events when:
- A cluster gets disconnected
- A backup location fails
- A backup fails
- A backup succeeds partially
- A restore fails
Benefits of alerts
-
Monitoring: users can monitor the health and status of backups, restores, cloud accounts, backup locations across different clusters
-
Troubleshooting: detailed information helps users diagnose issues and take corrective measures
History of alerts may also help for review and compliance purposes.
To access Alerts, click Alerts icon in the left navigation pane of Portworx Backup home page. Alerts page contains two tabs:

-
Alerts: the default tab view where active alerts are listed
-
Email Alerts Configuration: tab where you can configure email alerts settings for email notifications for the critical alerts that appear in the Alerts tab. Portworx Backup web console allows users to set up an SMTP configuration to send email alerts securely. It supports essential fields for SMTP settings, user authentication, and advanced options like enabling
STARTTLSfor encrypted communication.
To interact with the Alerts page, you can:
-
Click on an alert to expand and view detailed information related to each alert
-
Filter and sort the alerts to manage the visibility of the information based on the requirements
Search and Filters
-
Search by title, label: search input field to search alerts by specific keywords in the title or label
-
Filter by alert type: drop-down menu to filter alerts based on their type
Alerts table
Each alert is presented in a row with the associated information:
-
Details: an expandable section for each alert that provides more information about the issue that includes:
-
Error message or issue description
-
Specific identifiers for volumes, clusters, or namespaces related to the alert
-
Possible reason for the alert (for example, license expiry, internal error and so on)
-
-
SEVERITY: a color-coded icon indicating the severity of the alert
-
ALERTS: provides the name of the failed Portworx Backup operations or objects (backup, restore, backup location, and cluster) along with a brief description of the issue
-
CLUSTER: the name of the cluster associated with the failed operation
-
DATE: the date and time when the alert was generated. You can sort this column either by ascending or descending order of alert generation date and time by clicking on the arrows at the end of the column name. When the data is not sorted, web console always displays the latest record first.
The Portworx Backup web console displays the five most recent alerts on the dashboard, with each alert expiring 90 days after its trigger date. In other words, if there were only 5 alerts in total, dashboard will show zero alerts after 90 days.