All Backups
The All Backups page in the Portworx Backup web console provides a detailed view of all backups created by various users on different clusters linked with Portworx Backup. This page lists all the backups across various clusters, providing a comprehensive view of backup status, storage usage, and other critical metrics.
This page offers a detailed, at-a-glance view of all the backups across namespaces and clusters in Portworx Backup. It allows users to monitor backup status, view storage consumption, and manage backups efficiently. Understanding each component of this page ensures proper backup management in Kubernetes environments.
The backups shown on this page are scoped to your access. Administrators can view backups created by all users, while other users see only the backups they own or that have been shared with them.
How to access the All Backups page
-
From the home page, go to the left navigation pane.
-
Click Backups > All Backups.
To view backup schedules across all clusters, click Backups > Backup schedules. For more information, see Backup schedules.

Components
-
Filter by Clusters: a drop-down that filters the backups shown on this page by cluster. By default, backups from All Clusters are listed; select a specific cluster to view only its backups. You can search for a cluster by name.
-
Share Cluster Backups: allows the user to share all backups of the cluster (owned by them) with these three permissions (for the RBAC and permission prerequisites, see Share backups of a cluster):
- View-only
- Restore-only
- Full-access
For more information, see Share all backups of a cluster.
-
NS/VM Toggle:
- NS (Namespace): displays namespace-based backups. Namespaces in Kubernetes are logical separations within the cluster, and this view allows users to manage backups of entire namespaces.
- VM (Virtual Machine): if you have backed up VMs using Portworx Backup, this tab provides a view of VM backups.
-
Search by Backup Name: users can search for specific backups by name or by a backup label, which makes finding a particular backup easier, especially in environments with many backups.
- To search by name, enter the backup name.
- To search by label, enter a single label in the
key=valueorkey:valueformat, for example,app=mysql. You can search by only one label at a time.
The search applies to the backups in the selected NS or VM view, along with any other filters applied on the page.
-
Filter by status: This field helps to shortlist the backups with the following status:
- In-Progress
- Success
- Failed
- Partial success
- Deleting
- Delete pending
-
Filter by policies: filters the backups by the schedule policies (or schedules) associated with them.
-
Filter by users: filters the backups by the user who created them.
-
Time filter (Last 24 hours): a drop-down that filters the backups across all associated clusters of Portworx Backup by their creation time (the CREATE TIME column)
-
Last 24 hours
-
Last 1 week
-
Last 1 month
-
Custom: opens the Custom time-range dialog. Select the range by clicking the start and end dates on the two-month calendar — the read-only Start date and End date fields display your selection. This replaces the single calendar control, making long date-range selections (such as several months or years) easier and removing any ambiguity about which boundary you are setting.
- Dates later than the current date in the timezone selected in the Timezone drop-down are disabled and cannot be selected.
- A callout at the bottom of the dialog shows the selected date range and the timezone it applies to.
- Use Apply to apply the range (enabled only after both Start date and End date are set), Clear to reset the selection, or Today to move the calendar to the current date.
-
-
Timezone: a drop-down that controls the timezone used to display timestamps. All timestamps appear in the selected timezone, with the timezone shown next to the time, and downloaded reports use the same timezone. You can choose:
- Browser timezone (default): your web browser's local timezone.
- Custom Timezone: any timezone you pick from the list, shown as
UTC ±HH:MM - Region/City.
-
Download report: an icon that opens the Download report dialog, where you select a format and click Download. The report reflects any applied filters. Available formats:
-
CSV format (recommended): includes all UI data points and can integrate with third-party tools for custom dashboard reports.
-
PDF format: handles a limited amount of data based on the page dimensions.
noteA PDF report includes up to 20,000 backup entries and a CSV report up to 40,000 entries; report generation also stops after about four minutes, whichever limit is reached first. If your selection exceeds these limits, the report contains only partial data — narrow the date range using the Custom time filter and generate the report again for complete results.
-
-
Refresh icon: click this button to refresh the backup data on the page immediately. Otherwise, the data auto-refreshes every 5 minutes.
-
Backup Table Components:
-
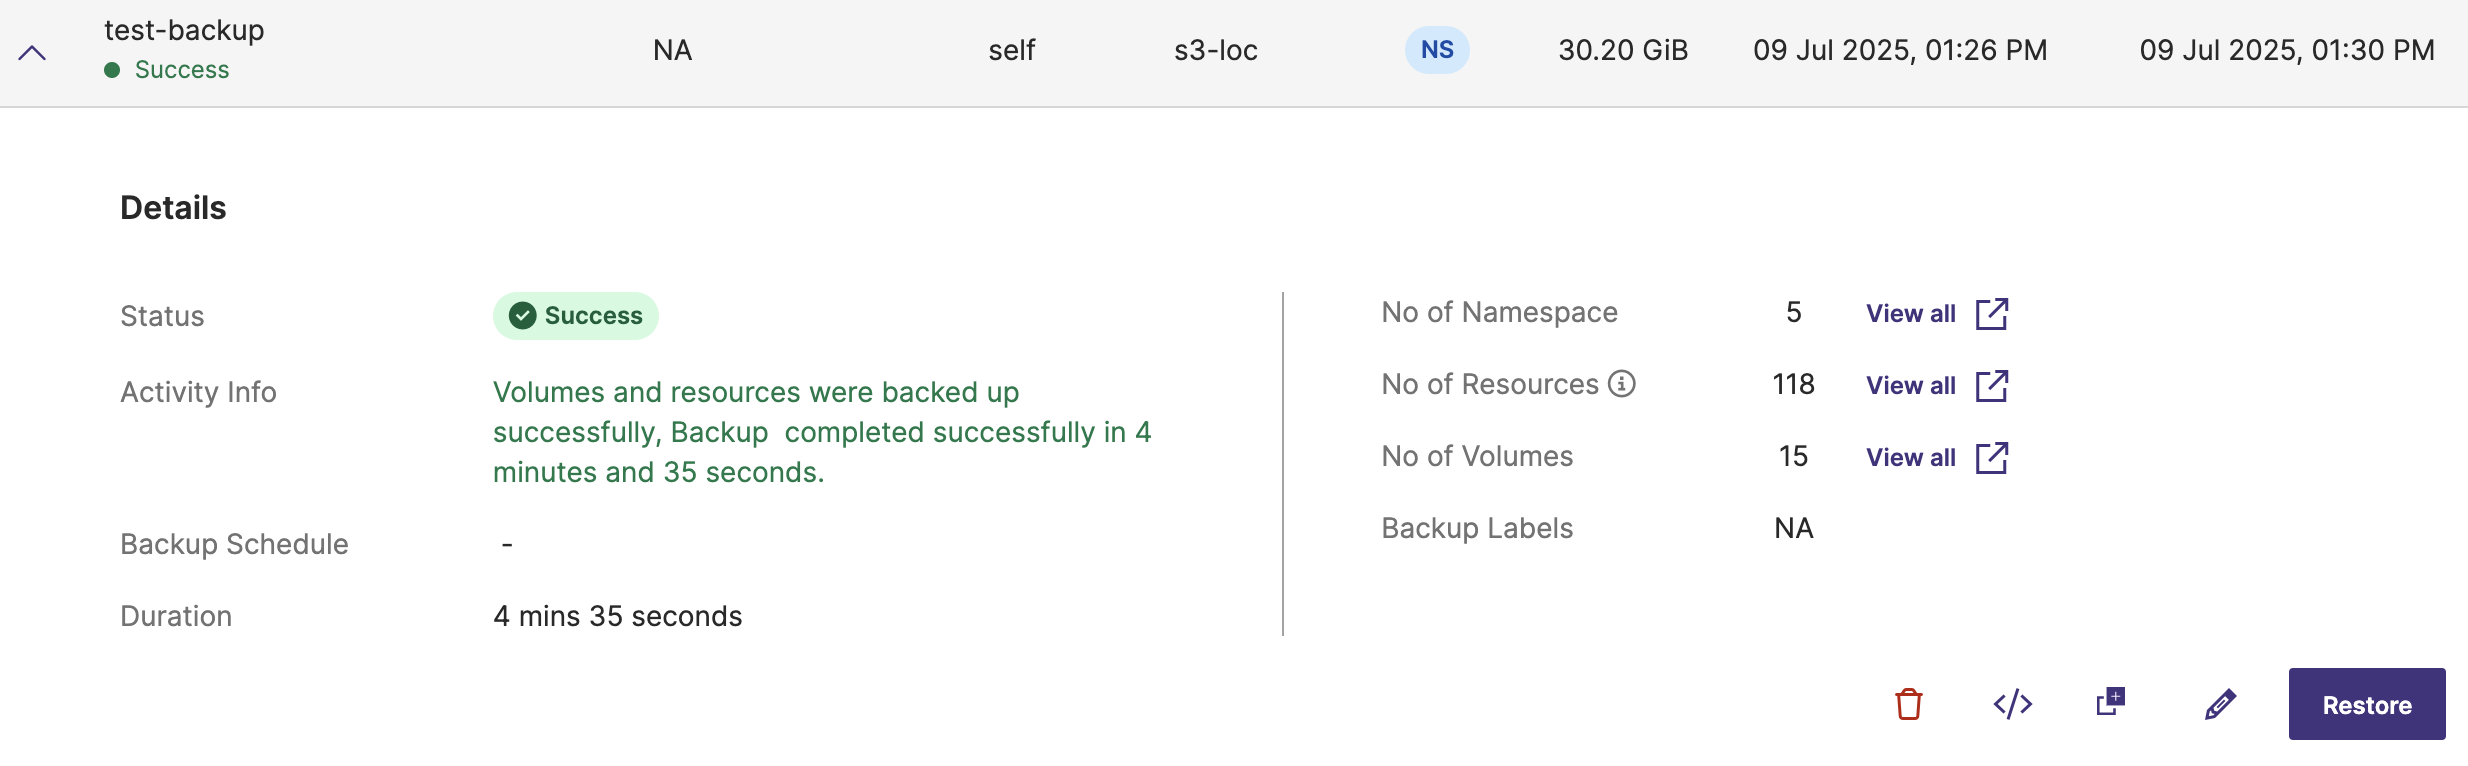
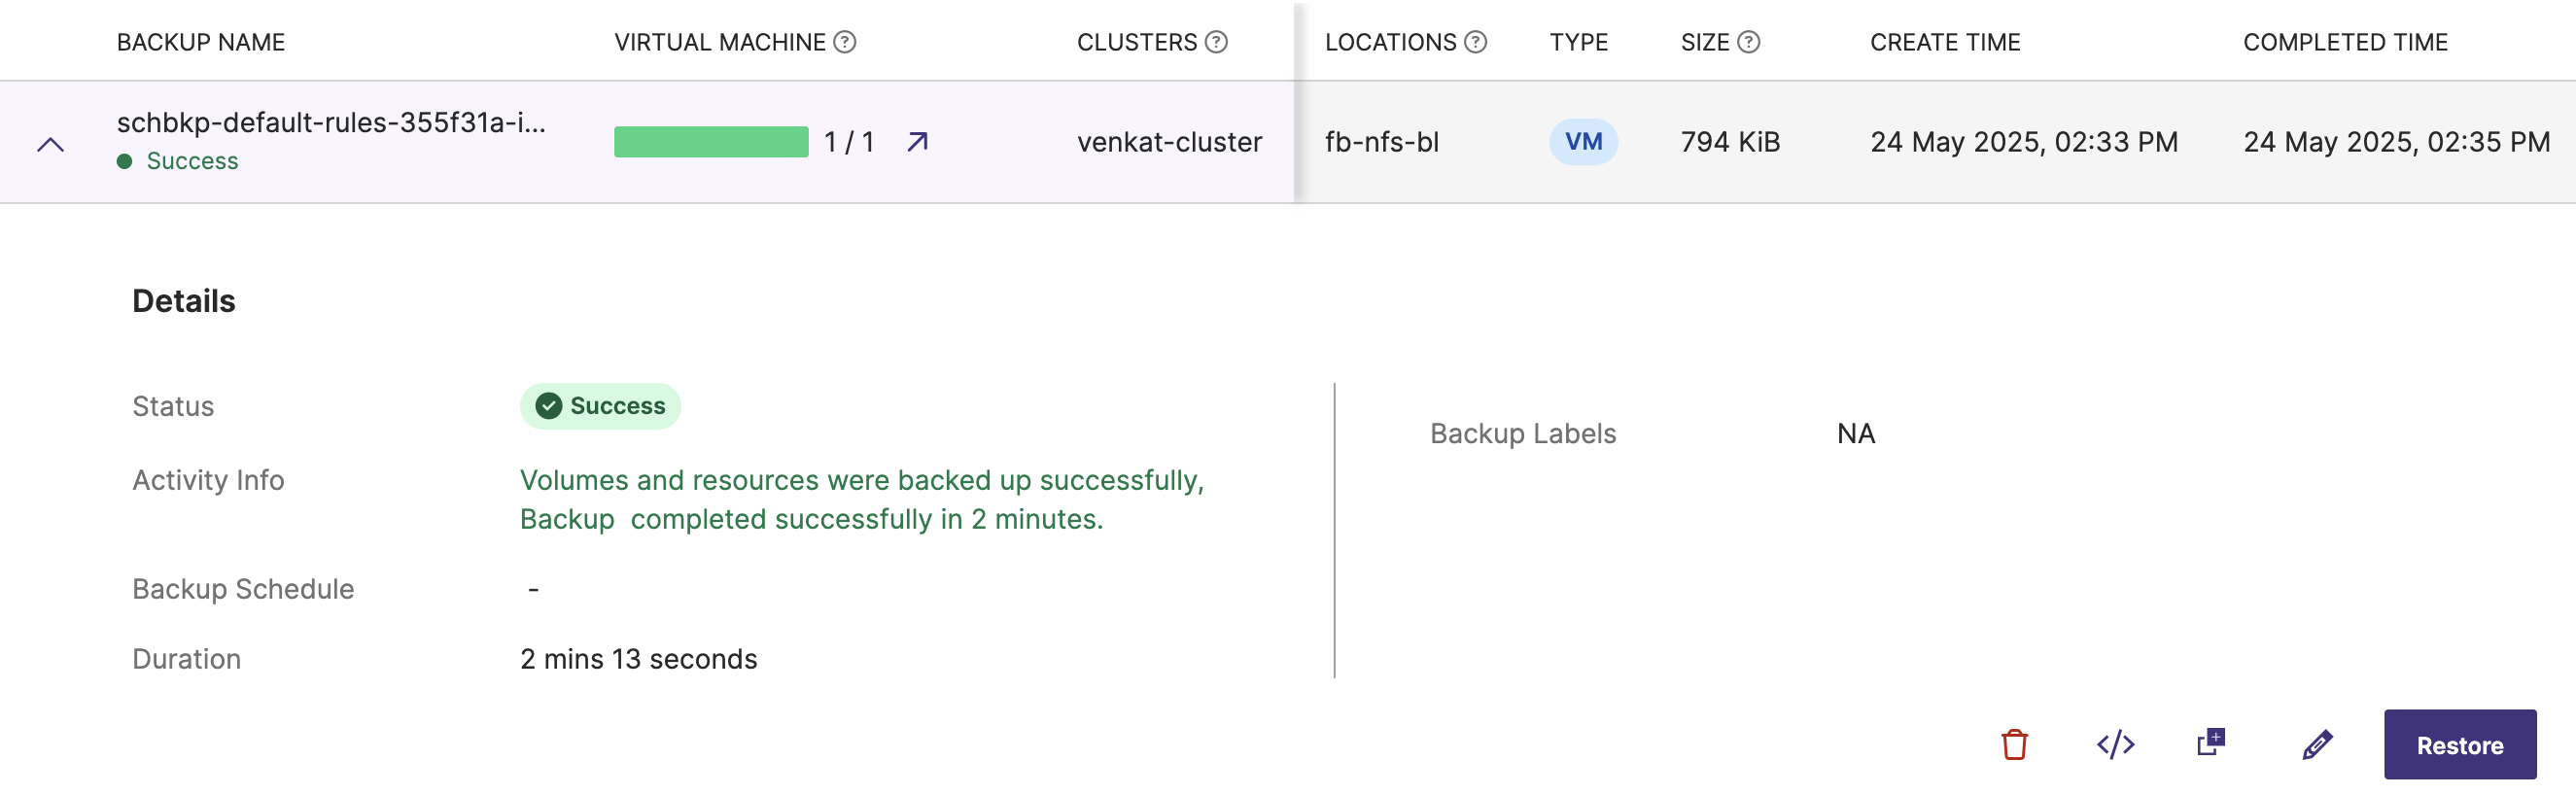
Details: an expandable arrow to give more information on the backup such as status, activity information, backup schedules, upcoming schedules, retention period information, number of namespaces/VMs, resources, and volumes backed up in namespace or VM backup.
-
Checkbox: allows you to select one, a few, or all of the backups on the page for bulk deletion. In Portworx Backup 3.2.0 and later, triggering a bulk delete immediately moves all the selected backups to Delete Pending and then Deleting, so they can no longer be restored. In earlier releases, the selected backups transitioned one by one, and a backup that had not yet reached the Deleting state could still be restored briefly after deletion was triggered.
-
BACKUP NAME: the name of each backup, helping users to identify their backups easily. In this case, you view the backups with user-defined or auto-generated names. You can sort this column either by ascending or descending order of backup name by clicking on the arrows at the end of the column name. When the data is not sorted, the web console always displays the latest record first.
-
Status: shown below the backup name, this indicates the state of the backup. It can be In-Progress, Success, Partial success, Failed, Deleting, or Delete pending.
You can click View All to view all the namespaces/VMs, resources, and volumes associated with the backup. This also gives options to delete, view JSON, duplicate, edit, and restore the backup.
-
Namespace backup details:
-
VM backup details:
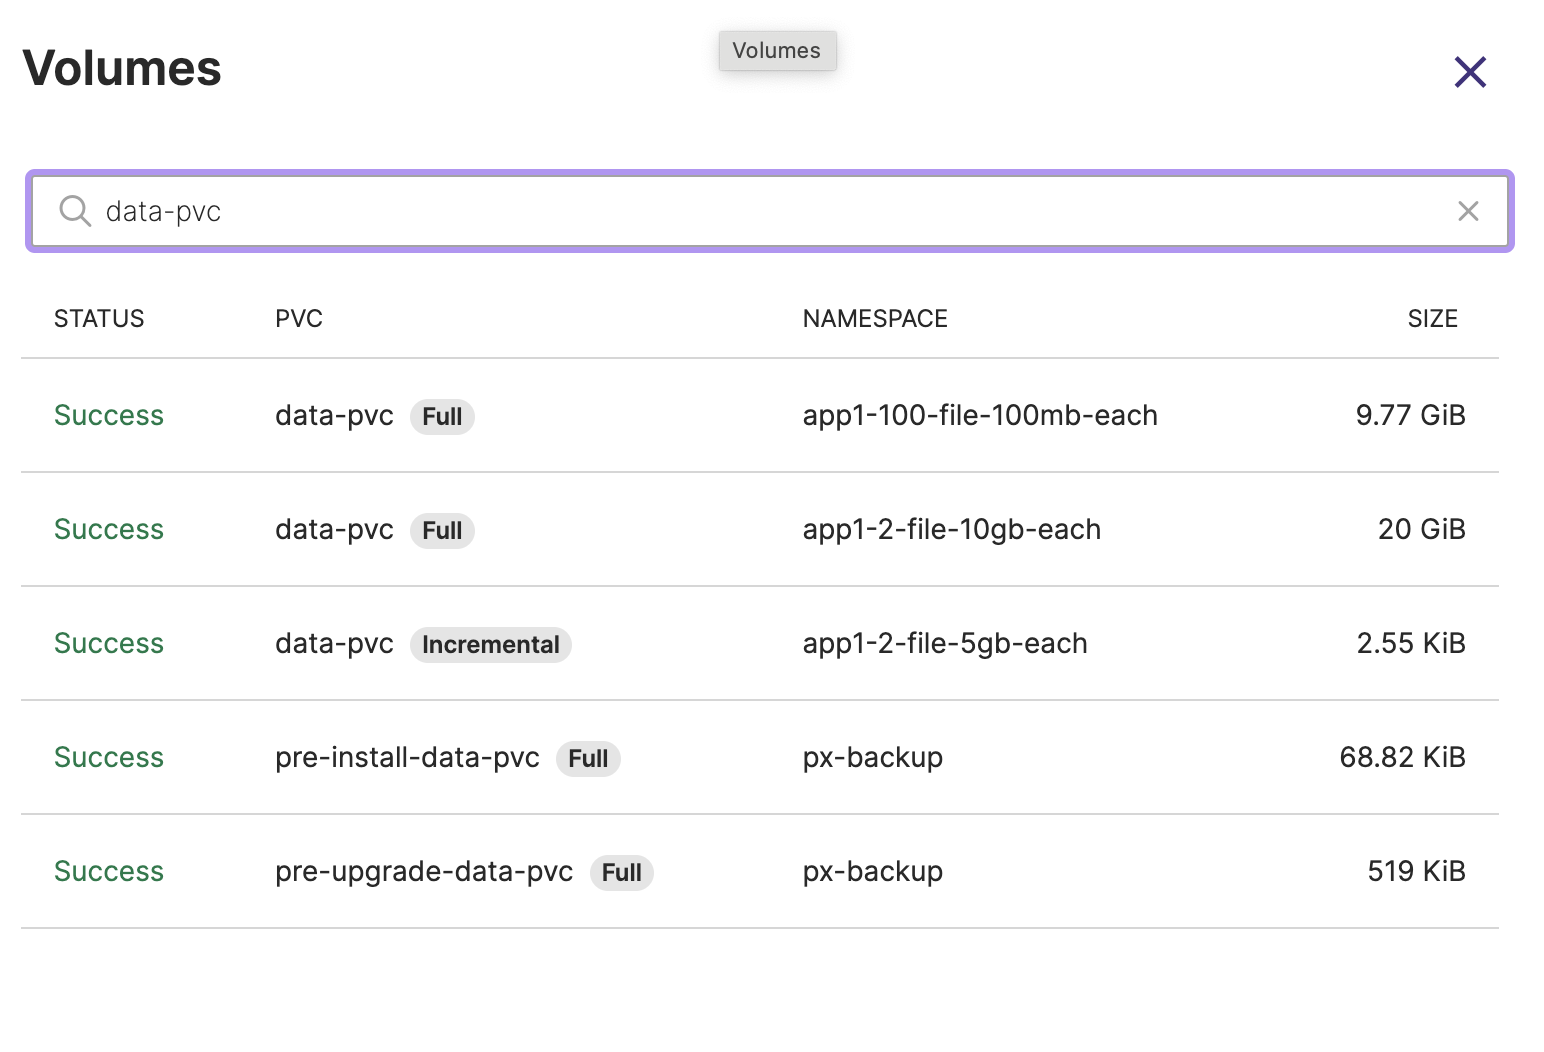
To learn if PVCs of Portworx volumes are Full or Incremental, you can click View all for No of volumes as shown here:
-
If an application is being backed up for the first time, a Full backup is created. For scheduled backups, subsequent backups are typically Incremental, capturing only the changes since the previous backup, until the incremental count defined in the schedule policy is reached. Portworx Backup then takes a new Full backup and starts a new backup chain. For more information, see Retain count and incremental count.
-
CLUSTER: indicates the Kubernetes cluster associated with the backup. This is crucial for identifying the cluster or the environment the backup belongs to, especially in multi-cluster setups. You can sort this column either by ascending or descending order of cluster name by clicking on the arrows at the end of the column name. When the data is not sorted, the web console always displays the latest backup entry first.
-
LOCATION: this shows the backup location where the backup is saved. This can be any backup location type supported by Portworx Backup, such as an object store bucket or container from a cloud provider or an on-premises object store, or an NFS share. For the supported backup location types, see Backup location matrix.
-
SIZE: the size of the backup, ranging from KBs to GBs, provides an overview of how much data is stored in each backup. You can sort this column either by ascending or descending order of backup data size by clicking on the arrows at the beginning of the column name. When the data is not sorted, the web console always displays the latest backup entry first.
-
CREATE TIME: this column shows the time stamp when the backup was created, enabling users to track and verify when backups were taken. You can sort this column either by ascending or descending order of backup create time by clicking on the arrows at the end of the column name. When the data is not sorted, the web console always displays the latest backup entry first.
-
COMPLETED TIME: the timestamp for the completion time of the backup
-
OWNER: indicates the user who created the backup. The owner's initials are shown, which is essential for auditing and accountability.
-
Lock icon: indicates that the backup data resides on a locked backup location.
-
Clock icon: this icon indicates that the backup has schedules associated with it, to be run at specified times with the given incremental count and retention period.
-
Vertical ellipsis:
- You can take further actions on each backup using the vertical ellipsis menu, such as restore, delete, share, edit, duplicate, or view detailed backup logs. This option provides flexibility for managing individual backups.
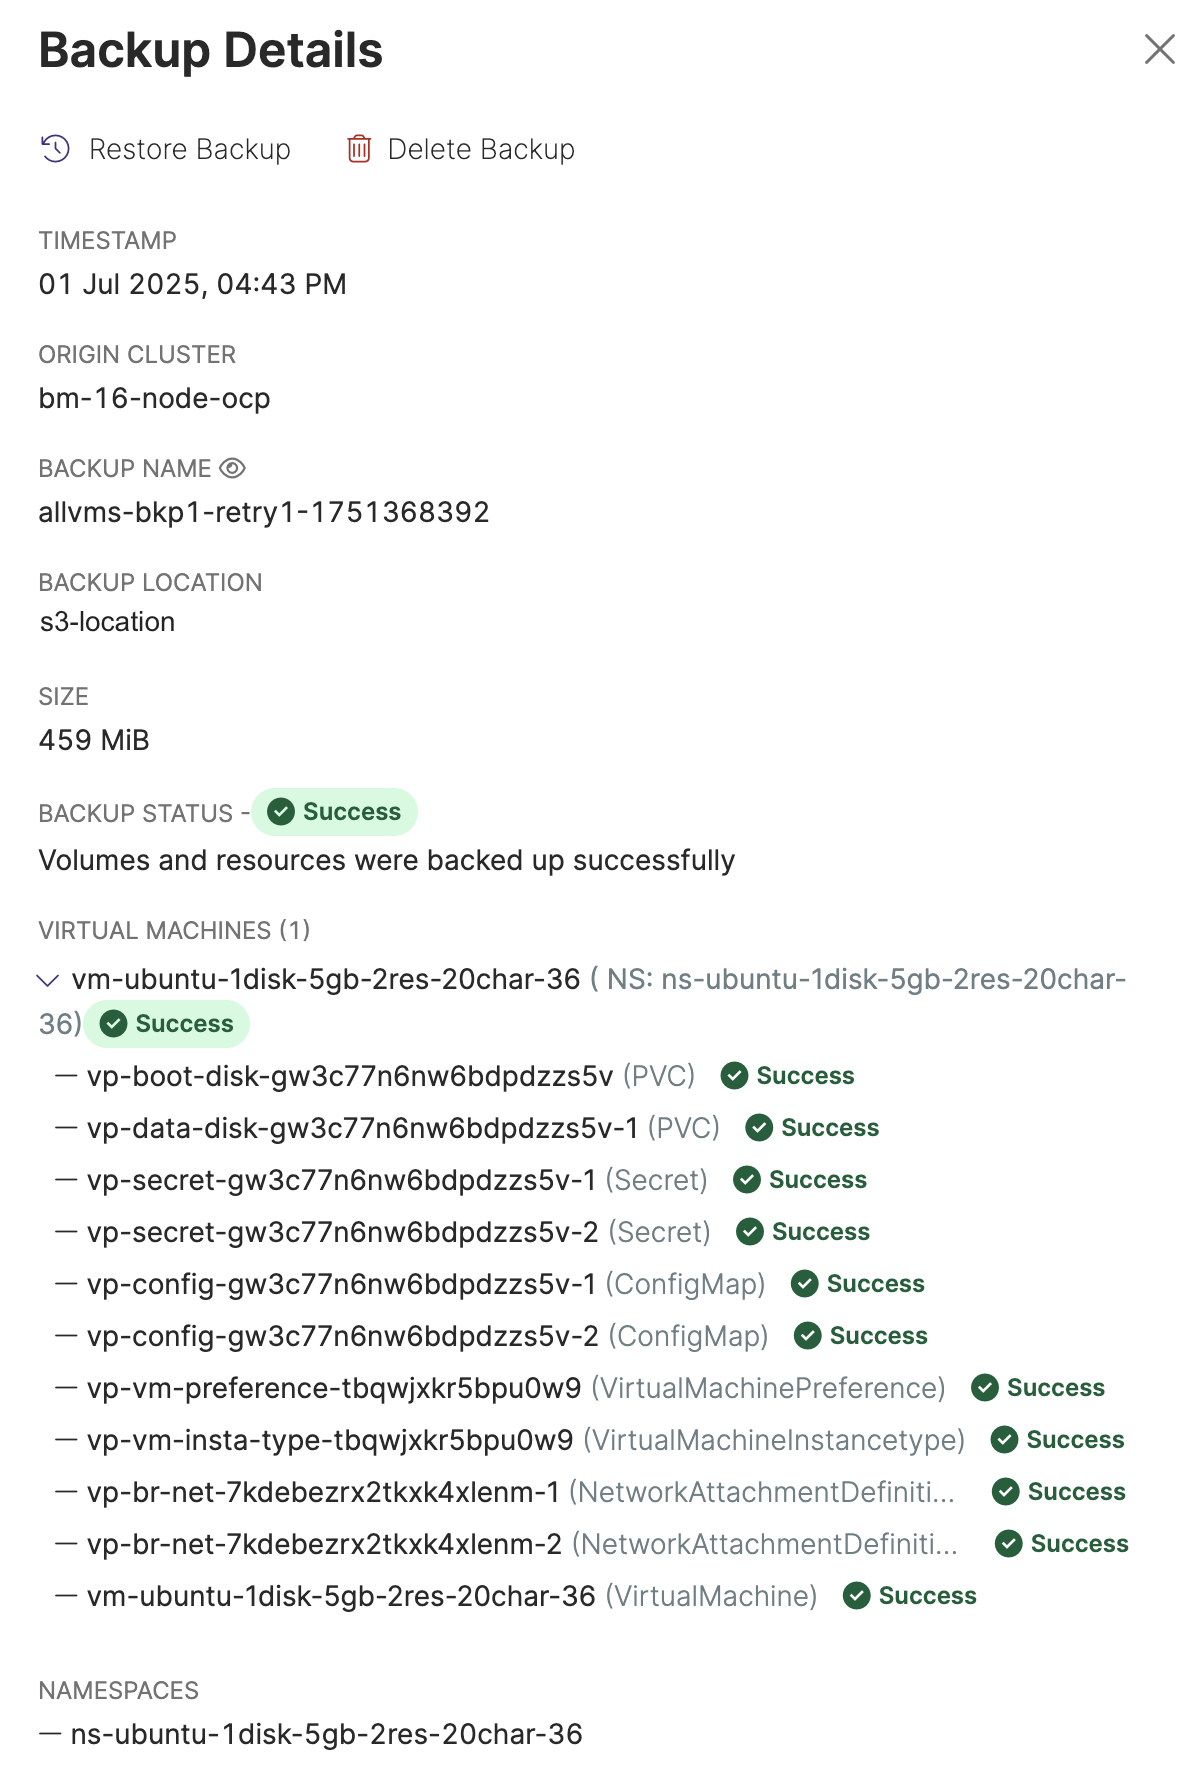
For VM backups, the Show Details option displays granular details of the VMs, the associated PVCs, resources, and the namespaces linked with the VMs as shown below. For large resource backups, the Show Details window displays only the PVCs associated with the VMs but not the resources.