Configure your Own Prometheus
This topic describes how to configure your own Prometheus in OpenShift Container Platform, SUSE Rancher and Kubernetes Vanilla application cluster environments. With this configuration you can monitor the clusters, backups, restores and other key information through Portworx Backup dashboard.
Openshift Container Platform
Prerequisites
OpenShift clusters have their own monitoring stack, hence Portworx by Everpure does not recommend to install Prometheus provided by Portworx Backup. Portworx Backup allows you to Bring Your Own Prometheus (BYOP) so that you can mount the OCP Prometheus Stack and pass the Prometheus and AlertManager end point of OCP cluster into Portworx Backup during installation to fetch metrics from those end points.
For OCP clusters, it is mandatory to use Portworx Backup email template if you want to configure email alerts using SMTP server for critical failures.
How to deploy OCP user monitoring
-
Enable user monitoring and Prometheus:
The cluster monitoring system, deployed in the Openshift-monitoring namespace by default, handles monitoring the OpenShift components only. OCP recommends users to enable the user workload monitoring system by creating the following ConfigMap:
apiVersion: v1
kind: ConfigMap
metadata:
 name: cluster-monitoring-config
 namespace: openshift-monitoring
data:
 config.yaml: |
   enableUserWorkload: true
Download yaml file cluster-monitoring-config.yaml and run this command in the OpenShift CLI.
oc apply -f cluster-monitoring-config.yamlThis triggers the OpenShift controllers to create a new monitoring stack (with Prometheus) in the
openshift-user-workload-monitoringnamespace, which takes care of monitoring the user applications running in all user namespaces. -
Enable user defined AlertManager in
openshift-user-workload-monitoringnamespace, by creating below ConfigMap:apiVersion: v1
kind: ConfigMap
metadata:
name: user-workload-monitoring-config
namespace: openshift-user-workload-monitoring
data:
config.yaml: |
alertmanager:
enabled: true
enableAlertmanagerConfig: trueDownload yaml file user-workload-monitoring-config.yaml and run this command in the OpenShift CLI. This configmap enables custom alerting capabilities for user-defined metrics.
oc apply -f user-workload-monitoring-config.yamlThis enables AlertManager and allows the AlertManager pod to monitor for AlertmanagerConfig which is a CR created by Portworx Backup.
Portworx by Everpure recommends the below procedure to ensure uninterrupted service and data retention from OCP Prometheus Stack.
Perform these steps in addition to the existing ConfigMap:
-
Increase the retention of data in Prometheus to 90 days by updating the below ConfigMap in
openshift-user-workload-monitoringnamespace.apiVersion: v1
kind: ConfigMap
metadata:
name: user-workload-monitoring-config
namespace: openshift-user-workload-monitoring
data:
config.yaml: |
prometheus:
retention: 90d
retentionSize: 8000MB -
Enable persistent volume to ensure data is retained in case of Prometheus pod crash. To do that, update the below ConfigMap in
openshift-user-workload-monitoringnamespace.apiVersion: v1
kind: ConfigMap
metadata:
name: user-workload-monitoring-config
namespace: openshift-user-workload-monitoring
data:
config.yaml: |
alertmanager:
enabled: true
enableAlertmanagerConfig: true
prometheus:
retention: 90d
retentionSize: 8000MB
volumeClaimTemplate:
spec:
storageClassName: <storage-class-name>
resources:
requests:
storage: 10GiReplace
<storage-class-name>with the actual storage class name. -
Upload the Portworx Backup email template into AlertManager pod. To upload Portworx Backup custom template to OCP user, you need to add template path into the AlertManager secret. The secret is base-64 encoded, so first decode the secret, add to the template reference line into the yaml and then encode the data once again to replace the original one. Edit the
secret/alertmanager-user-workloadinopenshift-user-workload-monitoringnamespace to upload a custom certificate.oc get secrets -n openshift-user-workload-monitoring alertmanager-user-workload --template='{{ index .data "alertmanager.yaml" }}' | base64 -d > alertmanager.yamlThis command should be run from the OpenShift CLI.
Sample output:
"receivers":
- "name": "Default"
"route":
  "group_by":
  - "namespace"
"receiver": "Default" -
Append
"templates": - "/etc/alertmanager/config/*.tmpl"to the output obtained from step 3 in the format shown below:"receivers":
- "name": "Default"
"route":
"group_by":
- "namespace"
"receiver": "Default"
"templates":
- "/etc/alertmanager/config/*.tmpl"This ensures that the custom Portworx Backup email template (which is about to get uploaded) is picked up by the AlertManager.
-
Encode the result with base-64:
cat alertmanager.yaml | base64 -
Copy the output value and replace it with
alertmanager.yamlin secretalertmanager-user-workloadof namespaceopenshift-user-workload-monitoring.For example:
oc edit secrets -n openshift-user-workload-monitoring alertmanager-user-workloadapiVersion: v1
data:
alertmanager.yaml: cm91dGU6CiAgcmVjZWl2ZXI6ICJudWxsIgpyZWNlaXZlcnM6Ci0gbmFtZTogIm51bGwiCnRlbXBsYXRlczogWyAiL2V0Yy9hbGVydG1hbmFnZXIvY29uZmlnLyoudG1wbCIgXQo= ## replace with the value you have generated -
Copy the following
pxc_template.tmplinto the same file:apiVersion: v1
kind: Secret
metadata:
name: alertmanager-user-workload
data:
alertmanager.yaml: cm91dGU6CiAgcmVjZWl2ZXI6ICJudWxsIgpyZWNlaXZlcnM6Ci0gbmFtZTogIm51bGwiCnRlbXBsYXRlczogWyAiL2V0Yy9hbGVydG1hbmFnZXIvY29uZmlnLyoudG1wbCIgXQo=
pxc_template.tmpl: PCFET0NUWVBFIGh0bWw+CjxodG1sPgogIDxoZWFkPgogICAgICA8dGl0bGU+UHgtQmFja3VwIEVtYWlsPC90aXRsZT4KICAgICAgPHN0eWxlPgogICAgICAgIGJvZHkgewogICAgICAgIGZvbnQtZmFtaWx5OiBzYW5zLXNlcmlmOwogICAgICAgIG1hcmdpbjogMDsKICAgICAgICBwYWRkaW5nOiAwOwogICAgICAgIGRpc3BsYXk6IGZsZXg7CiAgICAgICAganVzdGlmeS1jb250ZW50OiBjZW50ZXI7CiAgICAgICAgYmFja2dyb3VuZC1jb2xvcjogI2Y0ZjRmNDsKICAgICAgICB9CiAgICAgICAgLmNvbnRhaW5lciB7CiAgICAgICAgbWFyZ2luOiAyMHB4OwogICAgICAgIHBhZGRpbmc6IDIwcHg7CiAgICAgICAgYmFja2dyb3VuZC1jb2xvcjogI2ZmZjsKICAgICAgICBib3JkZXItcmFkaXVzOiA1cHg7CiAgICAgICAgYm94LXNoYWRvdzogMCAycHggNXB4IHJnYmEoMCwgMCwgMCwgMC4xKTsKICAgICAgICB9CiAgICAgICAgaDEgewogICAgICAgIGNvbG9yOiAjMzMzOwogICAgICAgIH0KICAgICAgICBwIHsKICAgICAgICBjb2xvcjogIzY2NjsKICAgICAgICB9CiAgICAgICAgdGQgewogICAgICAgIGNvbG9yOiAjMjkyOTI5OwogICAgICAgIGZvbnQtc2l6ZTogMTRweDsKICAgICAgICBmb250LXN0eWxlOiBub3JtYWw7CiAgICAgICAgZm9udC13ZWlnaHQ6IDQwMDsKICAgICAgICB9CiAgICAgICAgLmJvbGQtdGV4dCB7CiAgICAgICAgcGFkZGluZy1sZWZ0OiAyMHB4OwogICAgICAgIGZvbnQtd2VpZ2h0OiBib2xkOwogICAgICAgIH0KICAgICAgICAucGItMTYsCiAgICAgICAgdGQgewogICAgICAgIHBhZGRpbmctYm90dG9tOiAxNnB4OwogICAgICAgIH0KICAgICAgPC9zdHlsZT4KICA8L2hlYWQ+CiAgPGJvZHk+CiAgICAgIDxkaXYgY2xhc3M9ImNvbnRhaW5lciI+CiAgICAgICAgPGltZyBoZWlnaHQ9IjUwcHgiIHNyYz0iaHR0cHM6Ly9wb3J0d29yeC5jb20vd3AtY29udGVudC90aGVtZXMvcG9ydHdvcngvYXNzZXRzL2ltYWdlcy9oZWFkZXIvcG9ydHdvcngtbG9nby5wbmciIGFsdD0iIiBzcmNzZXQ9IiI+CiAgICAgICAge3sgcmFuZ2UgLkFsZXJ0cyB9fQogICAgICAgIHt7LSBpZiBlcSAuTGFiZWxzLmFsZXJ0bmFtZSAiQ2x1c3RlckFsZXJ0In19CiAgICAgICAgPGRpdgogICAgICAgICAgICBjbGFzcz0icGItMTYiCiAgICAgICAgICAgIHN0eWxlPSJ3aWR0aDogNDAwcHg7IGNvbG9yOiAjYmMxYjA2OyBmb250LXNpemU6IDE4cHg7IGZvbnQtd2VpZ2h0OiA1MDAiPgogICAgICAgICAgICBDcml0aWNhbCBBbGVydDogQ2x1c3RlciBEaXNjb25uZWN0ZWQKICAgICAgICA8L2Rpdj4KICAgICAgICA8ZGl2CiAgICAgICAgICAgIGNsYXNzPSJwYi0xNiIKICAgICAgICAgICAgc3R5bGU9IgogICAgICAgICAgICBjb2xvcjogdmFyKC0tY29udGVudC1vbkJhc2Utc3Ryb25nLCAjMjkyOTI5KTsKICAgICAgICAgICAgZm9udC1zaXplOiAxNnB4OwogICAgICAgICAgICBmb250LXdlaWdodDogNzAwOwogICAgICAgICAgICAiCiAgICAgICAgICAgID4KICAgICAgICAgICAgQWxlcnQgZGV0YWlscwogICAgICAgIDwvZGl2PgogICAgICAgIDx0YWJsZT4KICAgICAgICAgICAgPHRyPgogICAgICAgICAgICAgIDx0ZD5DbHVzdGVyIG5hbWU8L3RkPgogICAgICAgICAgICAgIDx0ZCBjbGFzcz0iYm9sZC10ZXh0Ij57eyAuTGFiZWxzLm5hbWUgfX08L3RkPgogICAgICAgICAgICA8L3RyPgogICAgICAgICAgICA8dHI+CiAgICAgICAgICAgICAgPHRkPkVycm9yPC90ZD4KICAgICAgICAgICAgICA8dGQgY2xhc3M9ImJvbGQtdGV4dCI+e3sgLkxhYmVscy5lcnJvcl9yZWFzb24gfX08L3RkPgogICAgICAgICAgICA8L3RyPgogICAgICAgICAgICA8dHI+CiAgICAgICAgICAgICAgPHRkPkNyZWF0aW9uIHRpbWU8L3RkPgogICAgICAgICAgICAgIDx0ZCBjbGFzcz0iYm9sZC10ZXh0Ij57eyAuU3RhcnRzQXQuRm9ybWF0ICIyMDA2LTAxLTAyIDE1OjA0OjA1IiB9fTwvdGQ+CiAgICAgICAgICAgIDwvdHI+CiAgICAgICAgPC90YWJsZT4KICAgICAgICB7ey0gZWxzZSBpZiBlcSAuTGFiZWxzLmFsZXJ0bmFtZSAiQmFja3VwQWxlcnQiIH19CiAgICAgICAgPGRpdgogICAgICAgICAgICBjbGFzcz0icGItMTYiCiAgICAgICAgICAgIHN0eWxlPSJ3aWR0aDogNDAwcHg7IGNvbG9yOiAjYmMxYjA2OyBmb250LXNpemU6IDE4cHg7IGZvbnQtd2VpZ2h0OiA1MDAiPgogICAgICAgICAgICBDcml0aWNhbCBBbGVydDogQmFja3VwIEZhaWxlZAogICAgICAgIDwvZGl2PgogICAgICAgIDxkaXYKICAgICAgICAgICAgY2xhc3M9InBiLTE2IgogICAgICAgICAgICBzdHlsZT0iCiAgICAgICAgICAgIGNvbG9yOiB2YXIoLS1jb250ZW50LW9uQmFzZS1zdHJvbmcsICMyOTI5MjkpOwogICAgICAgICAgICBmb250LXNpemU6IDE2cHg7CiAgICAgICAgICAgIGZvbnQtd2VpZ2h0OiA3MDA7CiAgICAgICAgICAgICIKICAgICAgICAgICAgPgogICAgICAgICAgICBBbGVydCBkZXRhaWxzCiAgICAgICAgPC9kaXY+CiAgICAgICAgPHRhYmxlPgogICAgICAgICAgICA8dHI+CiAgICAgICAgICAgICAgPHRkPkJhY2t1cCBuYW1lPC90ZD4KICAgICAgICAgICAgICA8dGQgY2xhc3M9ImJvbGQtdGV4dCI+e3sgLkxhYmVscy5uYW1lIH19PC90ZD4KICAgICAgICAgICAgPC90cj4KICAgICAgICAgICAgPHRyPgogICAgICAgICAgICAgIDx0ZD5DbHVzdGVyIG5hbWU8L3RkPgogICAgICAgICAgICAgIDx0ZCBjbGFzcz0iYm9sZC10ZXh0Ij57eyAuTGFiZWxzLmNsdXN0ZXIgfX08L3RkPgogICAgICAgICAgICA8L3RyPgogICAgICAgICAgICA8dHI+CiAgICAgICAgICAgICAgPHRkPkVycm9yPC90ZD4KICAgICAgICAgICAgICA8dGQgY2xhc3M9ImJvbGQtdGV4dCI+e3sgLkxhYmVscy5lcnJvcl9yZWFzb24gfX08L3RkPgogICAgICAgICAgICA8dHI+CiAgICAgICAgICAgICAgPHRkPkNyZWF0aW9uIHRpbWU8L3RkPgogICAgICAgICAgICAgIDx0ZCBjbGFzcz0iYm9sZC10ZXh0Ij57eyAuU3RhcnRzQXQuRm9ybWF0ICIyMDA2LTAxLTAyIDE1OjA0OjA1IiB9fTwvdGQ+CiAgICAgICAgICAgIDwvdHI+CiAgICAgICAgPC90YWJsZT4KICAgICAgICB7ey0gZWxzZSBpZiBlcSAuTGFiZWxzLmFsZXJ0bmFtZSAiUmVzdG9yZUFsZXJ0IiB9fQogICAgICAgIDxkaXYKICAgICAgICAgICAgY2xhc3M9InBiLTE2IgogICAgICAgICAgICBzdHlsZT0id2lkdGg6IDQwMHB4OyBjb2xvcjogI2JjMWIwNjsgZm9udC1zaXplOiAxOHB4OyBmb250LXdlaWdodDogNTAwIj4KICAgICAgICAgICAgQ3JpdGljYWwgQWxlcnQ6IFJlc3RvcmUgRmFpbGVkCiAgICAgICAgPC9kaXY+CiAgICAgICAgPGRpdgogICAgICAgICAgICBjbGFzcz0icGItMTYiCiAgICAgICAgICAgIHN0eWxlPSIKICAgICAgICAgICAgY29sb3I6IHZhcigtLWNvbnRlbnQtb25CYXNlLXN0cm9uZywgIzI5MjkyOSk7CiAgICAgICAgICAgIGZvbnQtc2l6ZTogMTZweDsKICAgICAgICAgICAgZm9udC13ZWlnaHQ6IDcwMDsKICAgICAgICAgICAgIgogICAgICAgICAgICA+CiAgICAgICAgICAgIEFsZXJ0IGRldGFpbHMKICAgICAgICA8L2Rpdj4KICAgICAgICA8dGFibGU+CiAgICAgICAgICAgIDx0cj4KICAgICAgICAgICAgICA8dGQ+UmVzdG9yZSBuYW1lPC90ZD4KICAgICAgICAgICAgICA8dGQgY2xhc3M9ImJvbGQtdGV4dCI+e3sgLkxhYmVscy5uYW1lIH19PC90ZD4KICAgICAgICAgICAgPC90cj4KICAgICAgICAgICAgPHRyPgogICAgICAgICAgICAgIDx0ZD5DbHVzdGVyIG5hbWU8L3RkPgogICAgICAgICAgICAgIDx0ZCBjbGFzcz0iYm9sZC10ZXh0Ij57eyAuTGFiZWxzLmNsdXN0ZXIgfX08L3RkPgogICAgICAgICAgICA8L3RyPgogICAgICAgICAgICA8dHI+CiAgICAgICAgICAgICAgPHRkPkVycm9yPC90ZD4KICAgICAgICAgICAgICA8dGQgY2xhc3M9ImJvbGQtdGV4dCI+e3sgLkxhYmVscy5lcnJvcl9yZWFzb24gfX08L3RkPgogICAgICAgICAgICA8dHI+CiAgICAgICAgICAgICAgPHRkPkNyZWF0aW9uIHRpbWU8L3RkPgogICAgICAgICAgICAgIDx0ZCBjbGFzcz0iYm9sZC10ZXh0Ij57eyAuU3RhcnRzQXQuRm9ybWF0ICIyMDA2LTAxLTAyIDE1OjA0OjA1IiB9fTwvdGQ+CiAgICAgICAgICAgIDwvdHI+CiAgICAgICAgPC90YWJsZT4KICAgICAgICB7ey0gZWxzZSBpZiBlcSAuTGFiZWxzLmFsZXJ0bmFtZSAiQmFja3VwTG9jYXRpb25BbGVydCIgfX0KICAgICAgICA8ZGl2CiAgICAgICAgICAgIGNsYXNzPSJwYi0xNiIKICAgICAgICAgICAgc3R5bGU9IndpZHRoOiA0MDBweDsgY29sb3I6ICNiYzFiMDY7IGZvbnQtc2l6ZTogMThweDsgZm9udC13ZWlnaHQ6IDUwMCI+CiAgICAgICAgICAgIENyaXRpY2FsIEFsZXJ0OiBCYWNrdXAgTG9jYXRpb24gRGlzY29ubmVjdGVkCiAgICAgICAgPC9kaXY+CiAgICAgICAgPGRpdgogICAgICAgICAgICBjbGFzcz0icGItMTYiCiAgICAgICAgICAgIHN0eWxlPSIKICAgICAgICAgICAgY29sb3I6IHZhcigtLWNvbnRlbnQtb25CYXNlLXN0cm9uZywgIzI5MjkyOSk7CiAgICAgICAgICAgIGZvbnQtc2l6ZTogMTZweDsKICAgICAgICAgICAgZm9udC13ZWlnaHQ6IDcwMDsKICAgICAgICAgICAgIgogICAgICAgICAgICA+CiAgICAgICAgICAgIEFsZXJ0IGRldGFpbHMKICAgICAgICA8L2Rpdj4KICAgICAgICA8dGFibGU+CiAgICAgICAgICAgIDx0cj4KICAgICAgICAgICAgICA8dGQ+QmFja3VwIExvY2F0aW9uPC90ZD4KICAgICAgICAgICAgICA8dGQgY2xhc3M9ImJvbGQtdGV4dCI+e3sgLkxhYmVscy5uYW1lIH19PC90ZD4KICAgICAgICAgICAgPC90cj4KICAgICAgICAgICAgPHRyPgogICAgICAgICAgICAgIDx0ZD5FcnJvcjwvdGQ+CiAgICAgICAgICAgICAgPHRkIGNsYXNzPSJib2xkLXRleHQiPnt7IC5MYWJlbHMuZXJyb3JfcmVhc29uIH19PC90ZD4KICAgICAgICAgICAgPHRyPgogICAgICAgICAgICAgIDx0ZD5DcmVhdGlvbiB0aW1lPC90ZD4KICAgICAgICAgICAgICA8dGQgY2xhc3M9ImJvbGQtdGV4dCI+e3sgLlN0YXJ0c0F0LkZvcm1hdCAiMjAwNi0wMS0wMiAxNTowNDowNSIgfX08L3RkPgogICAgICAgICAgICA8L3RyPgogICAgICAgIDwvdGFibGU+CiAgICAgICAge3stIGVuZCB9fQogICAgICAgIHt7IGVuZCB9fQogICAgICAgIDxkaXYgc3R5bGU9ImZvbnQtc2l6ZTogMTRweCIgY2xhc3M9InBiLTE2Ij4KICAgICAgICAgICAgUGxlYXNlIGxvZ2luIHRvIHlvdXIgUG9ydHdvcnggQmFja3VwIGRlcGxveW1lbnQgdG8gc2VlIG1vcmUgZGV0YWlscyBhbmQKICAgICAgICAgICAgdGFrZSBjb3JyZWN0aXZlIGFjdGlvbnMuCiAgICAgICAgPC9kaXY+CiAgICAgICAgPGRpdiBzdHlsZT0iZm9udC1zaXplOiAxNHB4IiBjbGFzcz0icGItMTYiPgogICAgICAgICAgICBCZXN0IFJlZ2FyZHMsPGJyIC8+UG9ydHdvcnggVGVhbQogICAgICAgIDwvZGl2PgogICAgICA8L2Rpdj4KICA8L2JvZHk+CjwvaHRtbD4KThis is the base-64 encoded html template for Portworx Backup email alert. Now AlertManager pods in
openshift-user-workload-monitoringnamespace will have the Portworx Backup template loaded into them and ready for use.noteAny error while applying Portworx backup email template results in an empty email for the users.
Configure secrets
-
Create
px-backupnamespace if not created already. -
Execute the following steps to create Prometheus and Alertmanger credentials in
px-backupnamespace required for the Portworx Backup dashboard.noteEnsure that you provide the
px-backupnamespace as a value forPXBACKUP_NAMESPACE.PXBACKUP_NAMESPACE=<px-backup-namespace>
PROMETHEUS_CERT=$(echo -n $(oc get secret prometheus-user-workload-tls --template='{{ index .data "tls.crt" }}' -n openshift-user-workload-monitoring) | base64 -d)
PROMETHEUS_TOKEN=$(oc create token prometheus-k8s -n openshift-monitoring --duration=87600h)
ALERTMANAGER_CERT=$(echo -n $(oc get secret alertmanager-user-workload-tls --template='{{ index .data "tls.crt" }}' -n openshift-user-workload-monitoring) | base64 -d)
ALERTMANAGER_TOKEN=$(oc create token thanos-ruler -n openshift-user-workload-monitoring --duration=87600h)
oc create secret generic prometheus-cred \
--from-literal=cert="$PROMETHEUS_CERT" \
--from-literal=token=$PROMETHEUS_TOKEN \
-n $PXBACKUP_NAMESPACE
oc create secret generic alertmanager-cred \
--from-literal=cert="$ALERTMANAGER_CERT" \
--from-literal=token=$ALERTMANAGER_TOKEN \
-n $PXBACKUP_NAMESPACE -
Provide the following details in the Spec Gen during Portworx Backup installation:
- Prometheus Endpoint: https://thanos-querier.openshift-monitoring.svc:9091
- Alertmanager Endpoint: https://alertmanager-user-workload.openshift-user-workload-monitoring.svc:9095
- Prometheus secret name: prometheus-cred
- Alertmanager secret name: alertmanager-cred
- Make sure you select Use custom email template from Px-Backup in the Spec Details tab of Spec Gen page.
Exposing metrics endpoint in OpenShift
OpenShift clusters have their own monitoring stack so to access the metrics endpoint, you need to create a Route to expose the px-backup service. You might have already created a route to access the Portworx Backup UI, similarly, you can create a route to access the metrics endpoint. See below steps to create a route for the px-backup service:
-
Go to Webconsole, Routes section
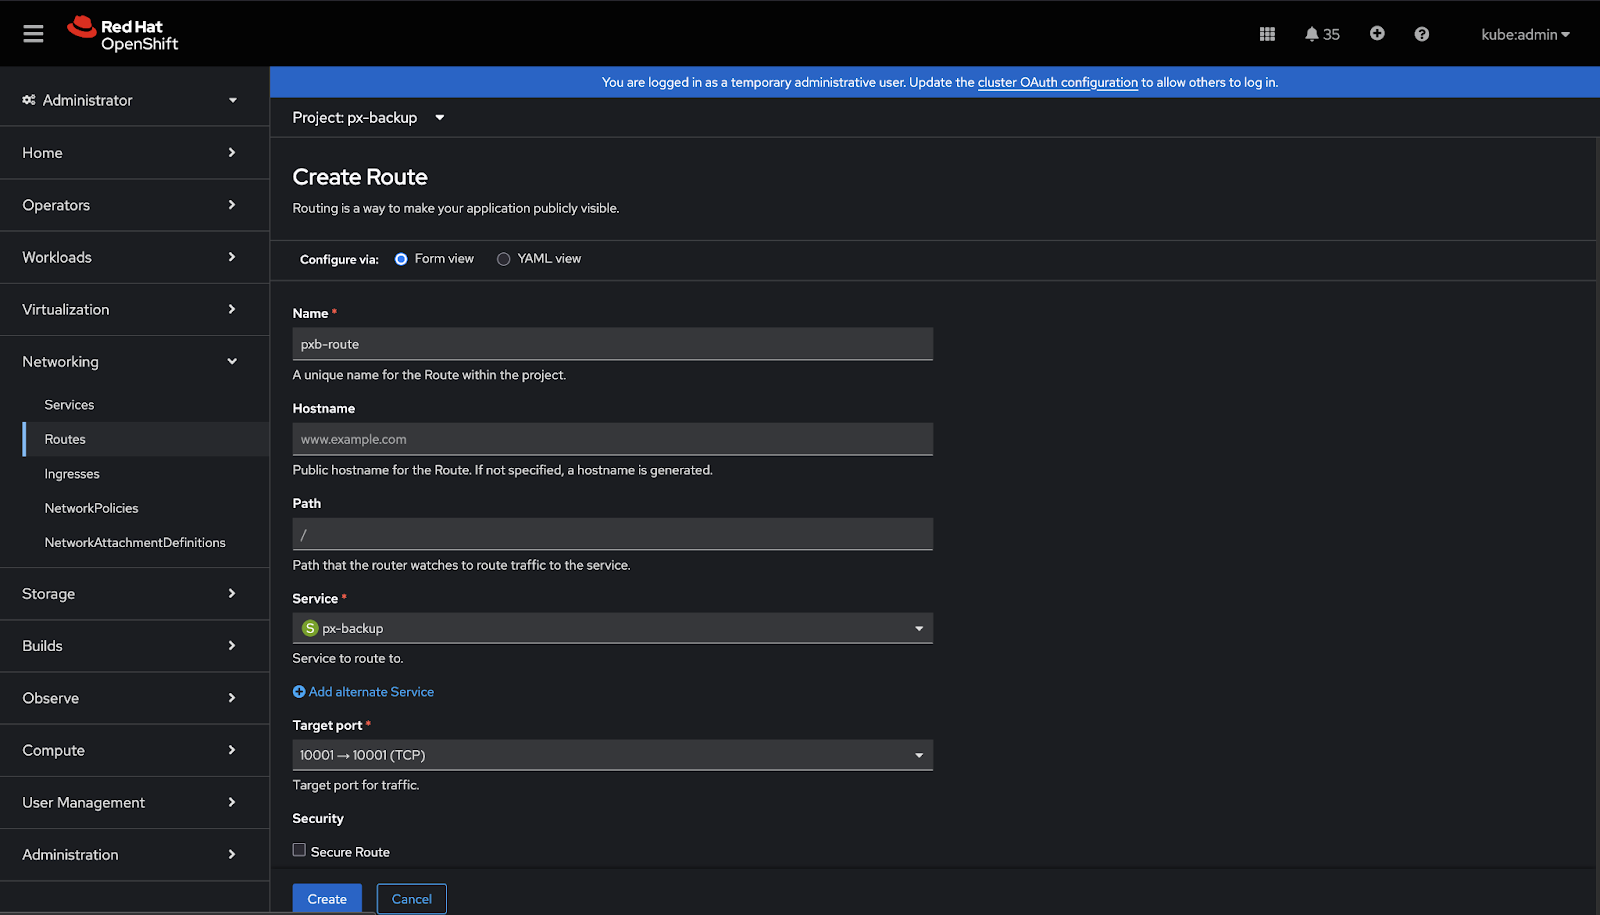
Open the web console, go to Networking > Routes, and then select the Create Route button.

-
Create new Route
On the Create Route page, configure your route by populating the following fields:
- Name: enter a descriptive name
- Hostname: specify a public hostname. If you leave this field empty, OpenShift will generate a hostname.
- Path: leave this field unchanged.
- Service: choose px-backup from the dropdown list.
- Target Port: choose 10001 -> 10001
-
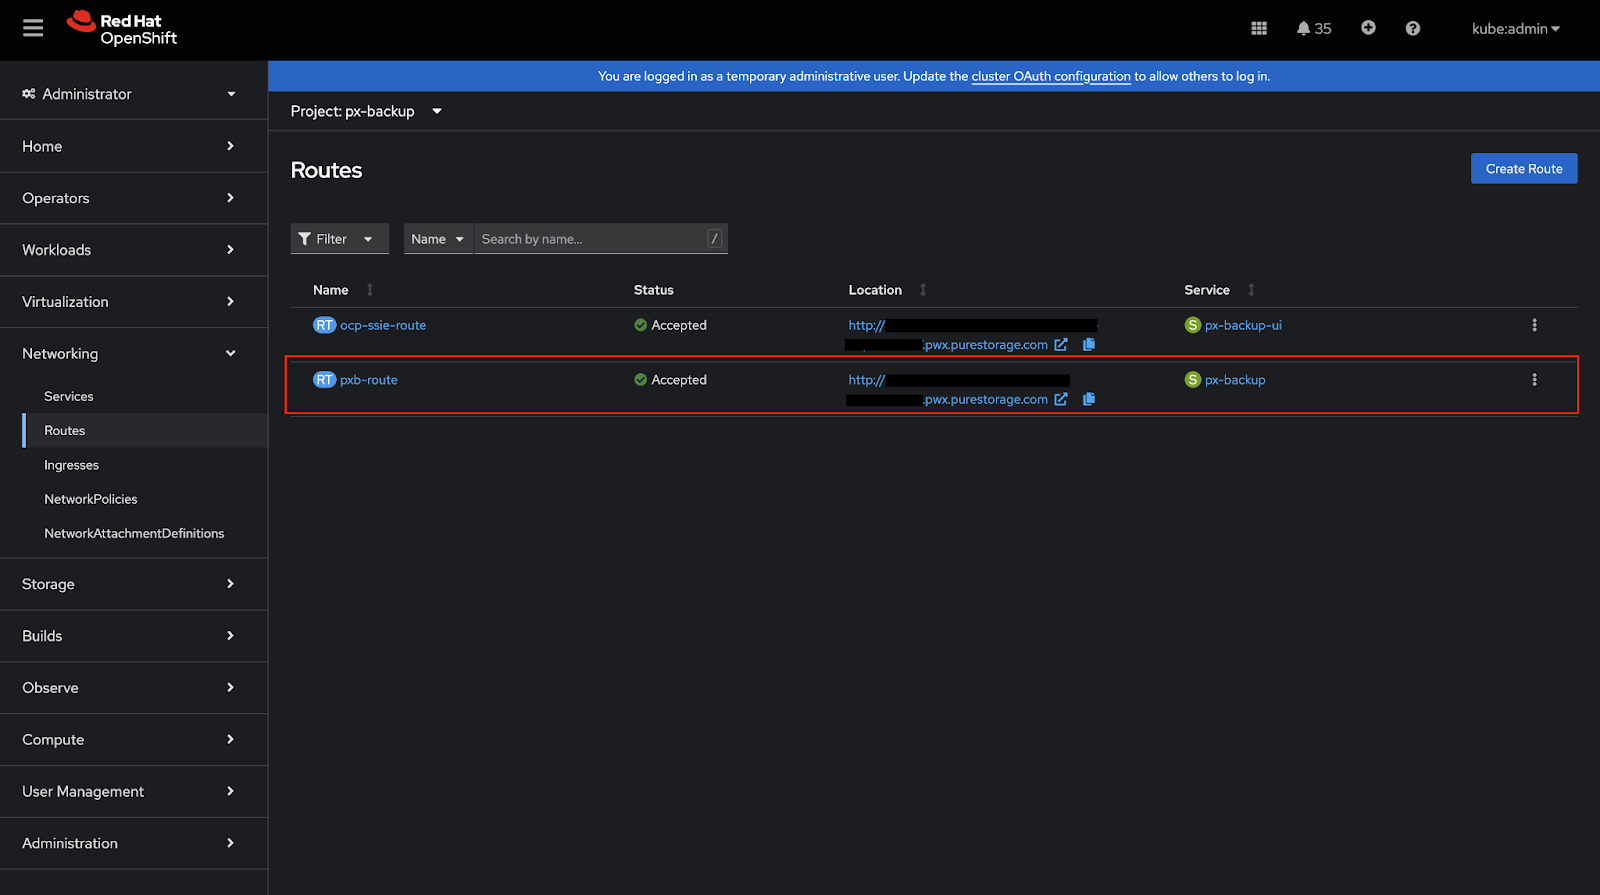
Verify Exposed Route
After hitting create button, wait and verify the route is successfully created on OpenShift and its status is ‘Accepted’
-
Accessing the Metrics Endpoint
Once the route is created, you can access the metrics endpoint at:
http://<location>/metricsWhere
<location>is the HTTP endpoint shown in OpenShift Networking > Routes page for px-backup service.Example (based on screenshot below):
http://foo.pwx.purestorage.com/metrics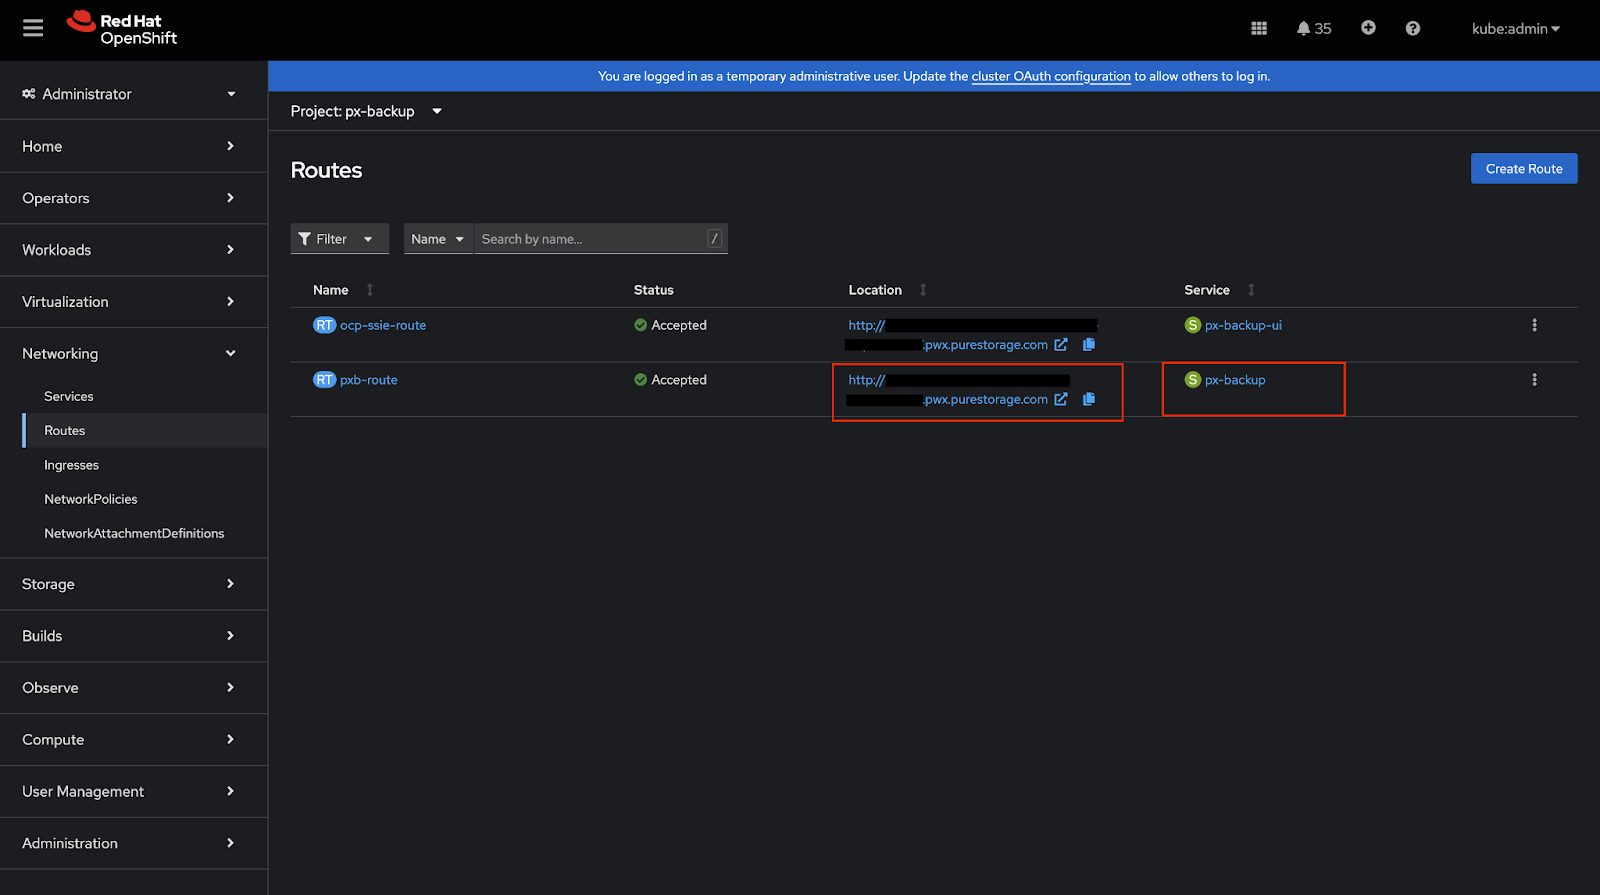
SUSE Rancher
Prerequisites
-
Ensure that Monitoring component is installed from Home > local > Cluster Tools through SUSE Rancher web console.
When the user has SUSE Rancher monitoring from Cluster Tools installed already in the cluster, user can make use of it with the Portworx Backup. Ensure that the Prometheus configuration parameters are in sync with the below prerequisites.
To check the configuration parameters in the SUSE Rancher web console:
-
Click on the local option (under Home icon) from the left navigation pane.
-
Navigate to Cluster Tools at the bottom and select Monitoring.
-
Populate Version, Install into Project, Customize Helm options..., Container Registry... and then click Next.
-
Choose Prometheus and:
-
Select Admin API
-
Enable Use:Monitors can access resources based on namespaces that match the namespace selector field
-
Set Scrape Interval and Evaluate Interval to 30s
-
Set Retention to 90d
-
Select Persistent storage for Prometheus
-
Provide Storage Class Name, Size, and Access Mode values
noteIf your Prometheus configuration parameters are not in sync with the above prerequisites, Portworx by Everpure recommends installing Portworx Backup's Prometheus stack.
-
Configure secrets
-
Create secrets with the below structure for Prometheus and AlertManager if it is configured with TLS, basic auth or bearer token in px-backup installed namespace.
data:
  username: <prometheus/alertmanager username>
  password: <prometheus/alertmanager password>
  token: <bearer-token>
cert: <certificate-data> -
Provide the secret names of Prometheus and AlertManager in the spec gen config parameters.
Kubernetes Vanilla cluster
Prerequisites
-
Retention time of metrics should be at least 90 days.
-
Storage size should be at least 5 Gi
-
Prometheus instance should be attached with persistent volumes
-
Prometheus scrape interval should be 30 seconds or below
-
Prometheus and AlertManager should be managed by the Prometheus operator
-
Make sure that your Prometheus stack can read the CR created by Portworx Backup in the namespace where it is installed:
  spec:
    alertmanagerConfigNamespaceSelector:
      matchExpressions:
    - key: name
      operator: In
      values:
      - px-backup #specify the name of namespace where px-backup is installed
alertmanagerConfigSelector: {} -
Create a Service Monitor:
  apiVersion: monitoring.coreos.com/v1
  kind: ServiceMonitor
  metadata:
    name: px-backup-monitor
    namespace: <BYOP installed ns>
    labels:
      release: kube-prometheus-stack
  spec:
    selector:
      matchLabels:
        app: px-backup
    namespaceSelector:
      matchNames:
        - px-backup
  endpoints:
  - port: rest-api
    path: /metrics
interval: 30s -
Change the following configuration in the CR:
root@ip-10-38-105-231:~# kubectl get prometheus -n <Prometheus>
NAME                               VERSION   DESIRED   READY   RECONCILED   AVAILABLE   AGE

kube-prometheus-stack-prometheus   v3.2.1    1         1       True         True        4d23h
root@ip-10-38-105-231:~# kubectl edit prometheus kube-prometheus-stack-prometheus -n <BYOP-installed-ns>
Replace this chunk of the spec:
ruleNamespaceSelector: {}
ruleSelector:
  matchLabels:
    release: kube-prometheus-stack
With the following data:
ruleNamespaceSelector: {}
ruleSelector: {}noteIf your Prometheus configuration parameters are not in sync with the above prerequisites, Portworx by Everpure recommends to install Prometheus stack provided by Portworx Backup.
Configure secrets
Users can configure with TLS without TLS, with basic auth or without basic auth, with bearer token or without bearer token. Here is a sample configuration to generate secrets with TLS:
-
Create secrets with the below structure for Prometheus and AlertManager if it is configured with TLS, basic auth or bearer token in
px-backupinstalled namespace.data:
username: <prometheus/alertmanager username>
password: <prometheus/alertmanager password>
token: <bearer-token>
cert: <certificate-data>Replace
<prometheus/alertmanager username>,<bearer-token>, and<certificate-data>with the appropriate values. Verify that these values are working by checking logs or running a test scrape. -
Provide the secret names of Prometheus and AlertManager in the spec gen config parameters.
Exposing metrics endpoint in Kubernetes
To expose the px-backup service in a Kubernetes cluster, you can use either a NodePort or LoadBalancer service type. Follow these steps:
-
Check Current Service
kubectl get svc -n px-backupNAME TYPE CLUSTER-IP EXTERNAL-IP PORT(S) AGE
px-backup ClusterIP 10.233.61.55 <none> 10002/TCP,10001/TCP 1d -
Expose the Service
Option A: NodePort (Recommended for Testing)
kubectl expose svc px-backup -n px-backup --type NodePort --port 10001 --name px-backup-metricsOption B: LoadBalancer (Recommended for Production)
kubectl expose svc px-backup -n px-backup --type LoadBalancer --port 10001 --name px-backup-metrics -
Verify Exposed Service
kubectl get svc px-backup-metrics -n px-backupNAME TYPE CLUSTER-IP EXTERNAL-IP PORT(S) AGE
px-backup-metrics NodePort 10.233.8.184 <none> 10001:31809/TCP 1m -
Accessing the Metrics Endpoint Once the service is exposed, access metrics at:
NodePort Access:
http://<node-ip>:<nodeport>/metricsExample:
http://192.168.1.100:31809/metricsLoadBalancer Access:
http://<external-ip>:10001/metricsExample:
http://20X.0.XXX.XX:10001/metrics
Next steps
After configuring your own Prometheus and exposing the metrics endpoint, you can configure Grafana to visualize your backup and restore metrics. For more information, see Configure Grafana for Portworx Backup.