Data services overview
You can access the Data Services Overview page in one of the following ways:
-
From the Clusters page:
- Select the vertical ellipsis menu in any of the listed clusters.
- Choose PDS Dashboard from the options.
-
From the PDS platform left pane, under the Data Services section, select Data Services Overview.
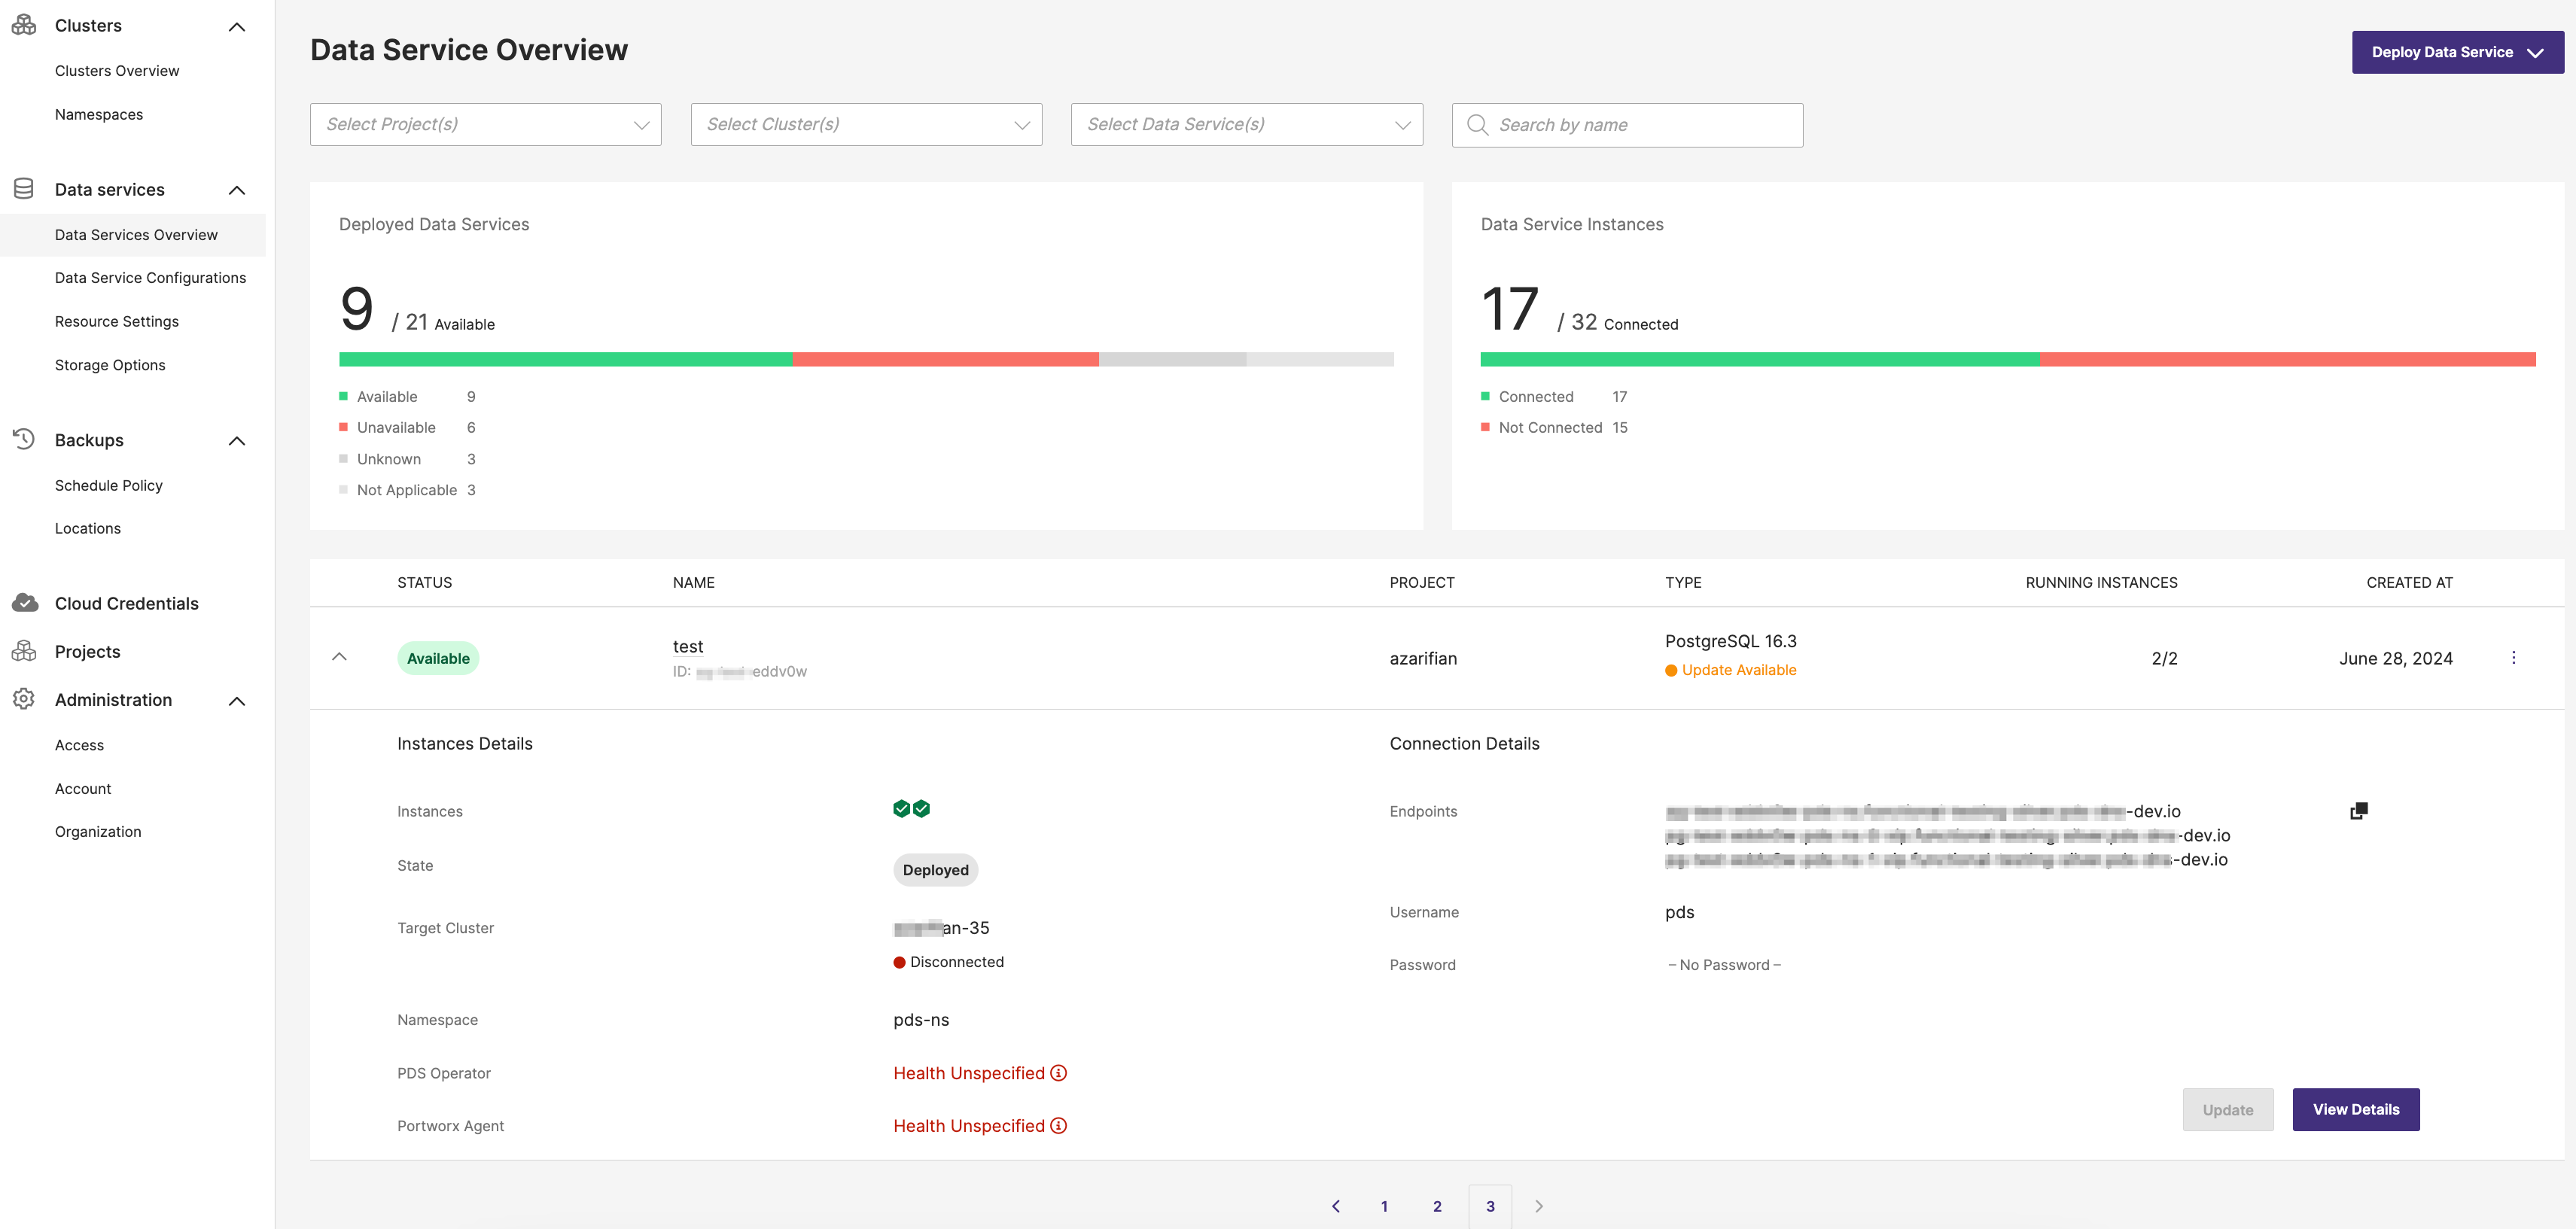
Overview
The Data Services Overview page acts as the central command panel for managing and monitoring the health and configurations of your distributed data services within the cloud-native ecosystem. It provides a snapshot of the current status, project associations, types, and operational metrics of your services, aiding in deployment, scaling, and maintenance.
Filter options
The Data Services Overview page includes the following filter options:
- Select Project(s): This drop-down menu allows you to filter the data services based on specific projects. You can select one or multiple projects to narrow down the displayed data services relevant to those projects.
- Select Cluster(s): This dropdown menu enables you to filter the data services based on the clusters they are deployed on. By selecting specific clusters, you can view the data services associated with those clusters.
- Select Data Service(s): This dropdown menu provides the option to filter by specific data services. You can choose one or more data services to see their details and status.
- Search by name: This search box allows you to quickly find a specific data service by typing its name.
Data services table columns
- STATUS: Indicates the availability status of the data services, with color-coded indicators, such as green for 'Available'.
- NAME: Displays the service name.
- PROJECT: Displays the project or namespace the data service belongs to.
- TYPE: Displays the type of the service being used.
- RUNNING INSTANCES: Displays the number of nodes currently running, shown as a fraction of the total required.
- CREATED AT: Displays the time since the service was last deployed or updated.
Status indicators
In the STATUS column, PDS platform displays the following indicators to assist you in assessing the readiness of a data service for use:
- Available: The number of ready replicas matches the desired number for deployment.
- Partially Available: The deployment has one or more ready replicas but fewer than the desired number.
- Unavailable: No ready replicas are available, or restoration is ongoing.
- Not Applicable: This health state occurs when the data service deployment is manually deleted from the target cluster. In this case, the health of the data service cannot be calculated, resulting in the phase moving to
DELETED_FROM_CLUSTERand the health state toNOT_APPLICABLE. - Unknown: The deployment health status is currently undeterminable.
Expanded data service details
When you expand a data service row, the interface provides detailed information about the selected data service:
Instances details section
- Instances: Indicates the status of the data service instances. A green checkmark signifies that the instances are healthy.
- State: Displays the current state of the data service. For example, Deployed, meaning the service is actively deployed and running.
- Target Cluster: Displays the name of the cluster where the data service is deployed. For example, a red dot indicating the cluster is Disconnected.
- Namespace: Specifies the namespace within the cluster where the data service is deployed.
- PDS Operator: Indicates the health status of the PDS Operator, which manages the deployment and lifecycle of data services within the cluster.
- Portworx Agent: Reflects the health of the Portworx Agent, responsible for facilitating communication between the PDS control plane and the target cluster.
Even if the overall data service health is marked as Available, the PDS Operator or Portworx Agent fields allow you to check the actual health status of the underlying components. This ensures you can identify and address any specific issues impacting the data service, such as a disconnected cluster or unspecified health conditions in the PDS Operator or Portworx Agent.
Connection details section
Endpoints: This section lists the endpoints for connecting to the data service. You can copy the endpoint URL by clicking on the icon next to each URL.
Username: This field displays the username required for accessing the data service. The default user name is pds.
Password: This indicates whether a password is set for accessing the data service.
Action buttons
- Update: Select this button to update the configuration or settings of the data service.
- View Details: Select this button to view more details about the data service, offering additional information and options for management.