Installation on VMware Tanzu Kubernetes Grid Integrated Edition
This topic provides instructions for installing Portworx in a VMware Tanzu Kubernetes Grid Integrated Edition (TKGI) environment. TKGI allows you to provision, operate, and manage vSphere-based Kubernetes clusters. You can deploy Portworx on TKGI environment using the shared datastores.
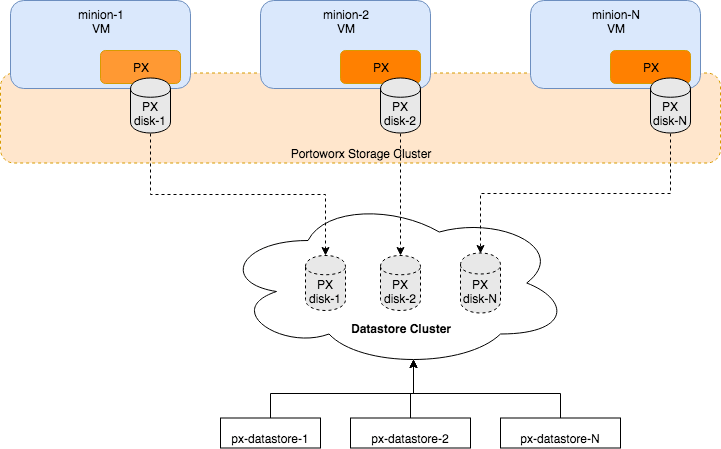
The following diagram gives an overview of the Portworx architecture on vSphere using shared datastores.
- Portworx runs on each Kubernetes minion/worker.
- Based on the given spec by the end user, Portworx on each node will create its disk on the configured shared datastores or datastore clusters.
- Portworx will aggregate all of the disks and form a single storage cluster. End users can carve PVCs (Persistent Volume Claims), PVs (Persistent Volumes) and Snapshots from this storage cluster.
- Portworx tracks and manages the disks that it creates. In a failure event, if a new VM spins up, Portworx on the new VM will be able to attach to the same disk that was previously created by the node on the failed VM.
The following collection of tasks describe how to install Portworx on a TKGI environment:
- Enable privileged containers and allow kubectl exec access
- Configure the BOSH Director add-on
- Create shared datastores
- Create a vCenter user account for Portworx
- Create a secret with your vCenter user credentials
- Generate Portworx Specification
- Apply the specification
- Verify Portworx Pod Status
- Verify Portworx Cluster Status
- Verify pxctl Cluster Provision Status
Complete all the tasks to install Portworx.
Enable privileged containers and allow kubectl exec access
Make sure the following settings are enabled for all plans in the Tanzu Kubernetes Grid Integration Edition tile of Tanzu Operations Mangager Interface:
- Enable Privileged Containers
- Disable DenyEscalatingExec to allow
kubectl execaccess for runningpxctlcommands.
Configure the BOSH Director add-on
The BOSH Director add-on enables upgrades to Portworx TKGI clusters with minimal disruption to availability and functionality.
During upgrade operations, the Kubernetes add-on expects all sharedv4 volumes to be unmounted. The Portworx add-on unmounts these volumes to support zero-downtime upgrades.
You can perform the following steps from any machine that has access to the BOSH CLI.
Upload a Portworx release to your Bosh Director environment
-
Run the following commands to clone the
portworx-stop-bosh-releaserepository and prepare the release:git clone https://github.com/portworx/portworx-stop-bosh-release.git
cd portworx-stop-bosh-release -
Create the Portworx release with a final version (in this example, version 2.0.0) using the Bosh CLI:
mkdir src
bosh create-release --final --version=2.0.0 -
Upload the release to your BOSH Director environment (replace director-environment with your environment name):
bosh -e director-environment upload-release
Add the add-on to the BOSH Director
-
Retrieve the current runtime configuration:
bosh -e director-environment runtime-config
- If this is empty, use the runtime config from runtime-configs/director-runtime-config.yaml.
- If a runtime config already exists, add the release and add-on definitions from runtime-configs/director-runtime-config.yaml into your current config.
-
Update the runtime config in the BOSH Director:
bosh -e director-environment update-runtime-config runtime-configs/director-runtime-config.yaml
Apply configuration changes in Tanzu Operations Manager
- Log in to the Tanzu Operations Manager console.
- Go to the Installation Dashboard.
- Click Review Pending Changes, then select and apply the changes.
If you cleared the Upgrade all clusters errands checkbox under Errands of the Tanzu Kubernetes Grid Integration Edition tile, run the following commands to reconfigure the add-on:
bosh manifest -d <deployment-name> > ./<deployment-name>-manifest.yaml
bosh -d <deployment-name> deploy ./<deployment-name>-manifest.yaml
For the required flags under the deploy command, see Deploy details in the Bosh documentation.
Create shared datastores
Create one or more shared datastores or datastore clusters dedicated to Portworx storage. Use a common prefix for the names of the datastores or datastore clusters. You must provide this prefix during the Portworx installation.
Create a vCenter user account for Portworx
Using your vSphere console, provide Portworx with a vCenter server user account that has the following minimum vSphere privileges at vCenter datacenter level:
-
Datastore
- Allocate space
- Browse datastore
- Low level file operations
- Remove file
-
Host
- Local operations
- Reconfigure virtual machine
-
Virtual machine
- Change Configuration
- Add existing disk
- Add new disk
- Add or remove device
- Advanced configuration
- Change Settings
- Extend virtual disk
- Modify device settings
- Remove disk
If you create a custom role as above, make sure to select Propagate to children when assigning the user to the role.
Why selectPropagate to Children?In vSphere, resources are organized hierarchically. By selecting "Propagate to Children," you ensure that the permissions granted to the custom role are automatically applied not just to the targeted object, but also to all objects within its sub-tree. This includes VMs, datastores, networks, and other resources nested under the selected resource.
Create a secret with your vCenter user credentials
Create a secret using the following steps.
- Kubernetes Secret
- Vault Secret
-
Get VCenter user and password by running the following commands:
- For
VSPHERE_USER:echo '<vcenter-server-user>' | base64 - For
VSPHERE_PASSWORD:echo '<vcenter-server-password>' | base64
- For
-
Update the following Kubernetes Secret template by using the values obtained in step 1 for
VSPHERE_USERandVSPHERE_PASSWORD.apiVersion: v1
kind: Secret
metadata:
name: px-vsphere-secret
namespace: <px-namespace>
type: Opaque
data:
VSPHERE_USER: XXXX
VSPHERE_PASSWORD: XXXX -
Apply the above spec to update the spec with your VCenter username and password:
kubectl apply -f <updated-secret-template.yaml>
For information on how to configure and store secret key for vSphere in Vault, see Vault Secret Provider.
Ensure that the correct vSphere credentials are securely stored in Vault before Portworx installation.
Generate Portworx Specification
To install Portworx, you must first generate Kubernetes manifests that you will deploy in your vSphere Kubernetes cluster by following these steps.
-
Sign in to the Portworx Central console.
The system displays the Welcome to Portworx Central! page. -
In the Portworx Enterprise section, select Generate Cluster Spec.
The system displays the Generate Spec page. -
From the Portworx Version dropdown menu, select the Portworx version to install.
-
From the Platform dropdown menu, select vSphere.
-
In the vCenter Endpoint field, specify the hostname or the IP address of the vSphere server.
-
In the vCenter Datastore Prefix field, specify the datastore name(s) or datastore cluster name(s) available for Portworx.
To specify multiple datastore names or datastore cluster names, enter a generic prefix common to all the datastores or datastore clusters. For example, if you want Portworx to use three datastores namedpx-datastore-01,px-datastore-02, andpx-datastore-03, specifypxorpx-datastore. -
From the Distribution Name dropdown menu, select VMware Tanzu Kubernetes Grid Integrated Edition (TKGI).
-
(Optional) To customize the configuration options and generate a custom specification, click Customize and perform the following steps:
noteTo continue without customizing the default configuration or generating a custom specification, proceed to Step 9.
- Basic tab:
- To use an existing etcd cluster, do the following:
- Select the Your etcd details option.
- In the field provided, enter the host name or IP and port number. For example,
http://test.com.net:1234.
To add another etcd cluster, click the + icon.noteYou can add up to three etcd clusters.
- Select one of the following authentication methods:
- Disable HTTPS – To use HTTP for etcd communication.
- Certificate Auth – To use HTTPS with an SSL certificate.
For more information, see Secure your etcd communication. - Password Auth – To use HTTPS with username and password authentication.
- To use an internal Portworx-managed key-value store (kvdb), do the following:
- Select the Built-in option.
- To enable TLS encrypted communication among KVDB nodes and between Portworx nodes and the KVDB cluster, select the Enable TLS for internal kvdb checkbox.
- If your cluster does not already have a cert-manager, select the Deploy Cert-Manager for TLS certificates checkbox.
- Select Next.
- To use an existing etcd cluster, do the following:
- Storage tab:
- To enable Portworx to provision drives using a specification, do the following:
- Select the Create Using a Spec option.
- To add one or more storage drive types for Portworx to use, click + Add Drive and select one of the following types of drives:
- Lazy-Zeroed Thick
- Eager-Zeroed Thick
- Thin
noteThe system automatically selects the minimum number of drives to ensure optimal performance.
- Configure the following fields for the drive:
- Size (GB) - Specify the size of the drive in gigabytes.
- Action - Use the trash icon to remove a drive type from the configuration.
- (Optional) To add more storage drives, click one of the following options based on the drive type:
- + Add Lazy-Zeroed Thick Drives
- + Add Eager-Zeroed Thick Drives
- + Add Thin Drives
- Initial Storage Nodes (Optional): Enter the number of storage nodes that need to be created across zones and node pools.
- From the Default IO Profile dropdown menu, select Auto.
This enables Portworx to automatically choose the best I/O profile based on detected workload patterns. - From the Journal Device dropdown menu, select one of the following:
- None – To use the default journaling setting.
- Auto – To automatically allocate journal devices.
- Custom – To manually choose a volume type for the journal device.
- To enable Portworx to use all available, unused, and unmounted drives on the node, do the following:
- Select the Consume Unused option.
- From the Journal Device dropdown menu, select one of the following:
- None – To use the default journaling setting.
- Auto – To automatically allocate journal devices.
- Custom – To manually enter a journal device path.
Enter the path of the journal device in the Journal Device Path field.
- Select the Use unmounted disks even if they have a partition or filesystem on it. Portworx will never use a drive or partition that is mounted checkbox to use unmounted disks, even if they contain a partition or filesystem.
Portworx will not use any mounted drive or partition.
- To enable Portworx to use existing drives on a node, do the following:
- Select the Use Existing Drives option.
- In the Drive/Device field, specify the block drive(s) that Portworx uses for data storage.
To add another block drive, click the + icon. - (Optional) In the Pool Label field, assign a custom label in key:value format to identify and categorize storage pools.
For more information refer to How to assign custom labels to device pools. - From the Journal Device dropdown menu, select one of the following:
- None – To use the default journaling setting.
- Auto – To automatically allocate journal devices.
- Custom – To manually enter a journal device path.
Enter the path of the journal device in the Journal Device Path field.
- Select Next.
- To enable Portworx to provision drives using a specification, do the following:
- Network tab:
- In the Interface(s) section, do the following:
- Enter the Data Network Interface to be used for data traffic.
- Enter the Management Network Interface to be used for management traffic.
- In the Advanced Settings section, do the following:
- Enter the Starting port for Portworx services.
- Select Next.
- In the Interface(s) section, do the following:
- Deployment tab:
- In the Kubernetes Distribution section, under Are you running on either of these?, select VMware Tanzu Kubernetes Grid Integrated Edition (TKGI).
- In the Component Settings section:
- Select the Enable Stork checkbox to enable Stork.
- Select the Enable Monitoring checkbox to enable Prometheus-based monitoring of Portworx components and resources.
- To configure how Prometheus is deployed and managed in your cluster, choose one of the following:
- Portworx Managed - To enable Portworx to install and manage Prometheus and Operator automatically.
Ensure that no another Prometheus Operator instance already running on the cluster. - User Managed - To manage your own Prometheus stack.
You must enter a valid URL of the Prometheus instance in the Prometheus URL field.
- Portworx Managed - To enable Portworx to install and manage Prometheus and Operator automatically.
- Select the Enable Autopilot checkbox to enable Portworx Autopilot.
For more information on Autopilot, see Expanding your Storage Pool with Autopilot. - Select the Enable Telemetry checkbox to enable telemetry in the StorageCluster spec.
For more information, see Enable Pure1 integration for upgrades on a vSphere cluster. - Enter the prefix for the Portworx cluster name in the Cluster Name Prefix field.
- Select the Secrets Store Type from the dropdown menu to store and manage secure information for features such as CloudSnaps and Encryption.
- In the Environment Variables section, enter name-value pairs in the respective fields.
- In the Registry and Image Settings section:
- Enter the Custom Container Registry Location to download the Docker images.
- Enter the Kubernetes Docker Registry Secret that serves as the authentication to access the custom container registry.
- From the Image Pull Policy dropdown menu, select Default, Always, IfNotPresent, or Never.
This policy influences how images are managed on the node and when updates are applied.
- In the Security Settings section, select the Enable Authorization checkbox to enable Role-Based Access Control (RBAC) and secure access to storage resources in your cluster.
- Click Finish.
- In the summary page, enter a name for the specification in the Spec Name field, and tags in the Spec Tags field.
- Click Download.yaml to download the yaml file with the customized specification or Save Spec to save the specification.
- Click Save & Download to generate the specification.
Apply the specification
Apply the generated specs to your cluster.
kubectl apply -f px-spec.yaml
Verify Portworx Pod Status
Enter the following command to list and filter the results for Portworx pods and specify the namespace where you have deployed Portworx:
kubectl get pods -n <px-namespace> -o wide | grep -e portworx -e px
NAME                                                    READY   STATUS    RESTARTS         AGE     IP                NODE                   NOMINATED NODE   READINESS GATES
portworx-api-774c2                                      1/1     Running   0                2m55s   192.168.121.196   username-k8s1-node0    <none>           <none>
portworx-api-t4lf9                                      1/1     Running   0                2m55s   192.168.121.99    username-k8s1-node1    <none>           <none>
portworx-api-dvw64                                      1/1     Running   0                2m55s   192.168.121.99    username-k8s1-node2    <none>           <none>
portworx-kvdb-94bpk                                     1/1     Running   0                4s      192.168.121.196   username-k8s1-node0    <none>           <none>
portworx-kvdb-8b67l                                     1/1     Running   0                10s     192.168.121.196   username-k8s1-node1    <none>           <none>
portworx-kvdb-fj72p                                     1/1     Running   0                30s     192.168.121.196   username-k8s1-node2    <none>           <none>
portworx-operator-58967ddd6d-kmz6c                      1/1     Running   0                4m1s    10.244.1.99       username-k8s1-node0    <none>           <none>
prometheus-px-prometheus-0                              2/2     Running   0                2m41s   10.244.1.105      username-k8s1-node0    <none>           <none>
px-cluster-xxxxxxxx-xxxx-xxxx-xxxx-3e9bf3cd834d-9gs79   2/2     Running   0                2m55s   192.168.121.196   username-k8s1-node0    <none>           <none>
px-cluster-xxxxxxxx-xxxx-xxxx-xxxx-3e9bf3cd834d-vpptx   2/2     Running   0                2m55s   192.168.121.99    username-k8s1-node1    <none>           <none>
px-cluster-xxxxxxxx-xxxx-xxxx-xxxx-3e9bf3cd834d-bxmpn   2/2     Running   0                2m55s   192.168.121.191   username-k8s1-node2    <none>           <none>
px-csi-ext-868fcb9fc6-54bmc                             4/4     Running   0                3m5s    10.244.1.103      username-k8s1-node0    <none>           <none>
px-csi-ext-868fcb9fc6-8tk79                             4/4     Running   0                3m5s    10.244.1.102      username-k8s1-node2    <none>           <none>
px-csi-ext-868fcb9fc6-vbqzk                             4/4     Running   0                3m5s    10.244.3.107      username-k8s1-node1    <none>           <none>
px-prometheus-operator-59b98b5897-9nwfv                 1/1     Running   0                3m3s    10.244.1.104      username-k8s1-node0    <none>           <none>
Note the name of a px-cluster pod. You will run pxctl commands from these pods in Verify pxctl Cluster Provision Status.
Verify Portworx Cluster Status
You can find the status of the Portworx cluster by running pxctl status commands from a pod.
Enter the following kubectl exec command, specifying the pod name you retrieved in Verify Portworx Pod Status:
kubectl exec <pod-name> -n <px-namespace> -- /opt/pwx/bin/pxctl status
Defaulted container "portworx" out of: portworx, csi-node-driver-registrar
Status: PX is operational
Telemetry: Disabled or Unhealthy
Metering: Disabled or Unhealthy
License: Trial (expires in 31 days)
Node ID: xxxxxxxx-xxxx-xxxx-xxxx-70c31d0f478e
    IP: 192.168.121.99
    Local Storage Pool: 1 pool
    POOL    IO_PRIORITY     RAID_LEVEL      USABLE  USED    STATUS  ZONE    REGION
    0       HIGH            raid0           3.0 TiB 10 GiB  Online  default default
    Local Storage Devices: 3 devices
    Device  Path            Media Type              Size            Last-Scan
    0:1     /dev/vdb        STORAGE_MEDIUM_MAGNETIC 1.0 TiB         14 Jul 22 22:03 UTC
    0:2     /dev/vdc        STORAGE_MEDIUM_MAGNETIC 1.0 TiB         14 Jul 22 22:03 UTC
    0:3     /dev/vdd        STORAGE_MEDIUM_MAGNETIC 1.0 TiB         14 Jul 22 22:03 UTC
    * Internal kvdb on this node is sharing this storage device /dev/vdc  to store its data.
    total           -       3.0 TiB
    Cache Devices:
        * No cache devices
Cluster Summary
    Cluster ID: px-cluster-xxxxxxxx-xxxx-xxxx-xxxx-3e9bf3cd834d
    Cluster UUID: xxxxxxxx-xxxx-xxxx-xxxx-6f3fd5522eae
    Scheduler: kubernetes
    Nodes: 3 node(s) with storage (3 online)
    IP              ID                                      SchedulerNodeName       Auth            StorageNode     Used    Capacity        Status  StorageStatus       Version         Kernel                  OS
    192.168.121.196 xxxxxxxx-xxxx-xxxx-xxxx-fad8c65b8edc    username-k8s1-node0      Disabled        Yes             10 GiB  3.0 TiB         Online  Up 2.11.0-81faacc   3.10.0-1127.el7.x86_64  CentOS Linux 7 (Core)
    192.168.121.99  xxxxxxxx-xxxx-xxxx-xxxx-70c31d0f478e    username-k8s1-node1      Disabled        Yes             10 GiB  3.0 TiB         Online  Up (This node)      2.11.0-81faacc  3.10.0-1127.el7.x86_64  CentOS Linux 7 (Core)
    192.168.121.191 xxxxxxxx-xxxx-xxxx-xxxx-19d45b4c541a    username-k8s1-node2      Disabled        Yes             10 GiB  3.0 TiB         Online  Up  2.11.0-81faacc  3.10.0-1127.el7.x86_64  CentOS Linux 7 (Core)
Global Storage Pool
    Total Used      :  30 GiB
    Total Capacity  :  9.0 TiB
Status displays PX is operational when the cluster is running as expected.
Verify pxctl Cluster Provision Status
-
Access the Portworx CLI.
-
Run the following command to find the storage cluster:
kubectl -n <px-namespace> get storageclusterNAME CLUSTER UUID STATUS VERSION AGE
px-cluster-xxxxxxxx-xxxx-xxxx-xxxx-3e9bf3cd834d xxxxxxxx-xxxx-xxxx-xxxx-6f3fd5522eae Online 2.11.0 10mThe status must display the cluster is
Online. -
Run the following command to find the storage nodes:
kubectl -n <px-namespace> get storagenodesNAME ID STATUS VERSION AGE
username-k8s1-node0 xxxxxxxx-xxxx-xxxx-xxxx-fad8c65b8edc Online 2.11.0-81faacc 11m
username-k8s1-node1 xxxxxxxx-xxxx-xxxx-xxxx-70c31d0f478e Online 2.11.0-81faacc 11m
username-k8s1-node2 xxxxxxxx-xxxx-xxxx-xxxx-19d45b4c541a Online 2.11.0-81faacc 11mThe status must display the nodes are
Online. -
Verify the Portworx cluster provision status by running the following command.
Specify the pod name you retrieved in Verify Portworx Pod Status.kubectl exec <px-pod> -n <px-namespace> -- /opt/pwx/bin/pxctl cluster provision-statusNODE NODE STATUS POOL POOL STATUS IO_PRIORITY SIZE AVAILABLE USED PROVISIONED ZONE REGION RACK
0c99e1f2-9d49-xxxx-xxxx-xxxxxxxxxxxx Up 0 ( 8ec9e6aa-7726-xxxx-xxxx-xxxxxxxxxxxx ) Online HIGH 32 GiB 32 GiB 33 MiB 0 B default default default
1e89102f-0510-xxxx-xxxx-xxxxxxxxxxxx Up 0 ( 06fcc73a-7e2f-xxxx-xxxx-xxxxxxxxxxxx ) Online HIGH 32 GiB 32 GiB 33 MiB 0 B default default default
24508311-e2fe-xxxx-xxxx-xxxxxxxxxxxx Up 0 ( 58ab2e3f-a22e-xxxx-xxxx-xxxxxxxxxxxx ) Online HIGH 32 GiB 32 GiB 33 MiB 0 B default default default
What to do next
Create a PVC. For more information, see Create your first PVC.