Installation using Rancher Console
This topic provides instructions for installing Portworx Enterprise from the Catalogs section of the SUSE Rancher console.
The following collection of tasks describe how to install Portworx on a Rancher Kubernetes Engine 2 (RKE2) using the SUSE Rancher console:
- Install Portworx Enterprise using the Rancher console
- Verify Portworx Pod Status
- Verify Portworx Cluster Status
- Verify Portworx Pool Status
- Verify pxctl Cluster Provision Status
Complete all the tasks to install Portworx.
Install Portworx Enterprise using the Rancher console
Perform the following steps to install Portworx Enterprise.
-
Open the SUSE Rancher console
Go to the Rancher console for your cluster. In the left sidebar menu, go to Apps and select Charts. -
Search for Portworx Enterprise
On the Charts page, use the search bar at the top to find Portworx Enterprise. A Portworx Enterprise chart should appear.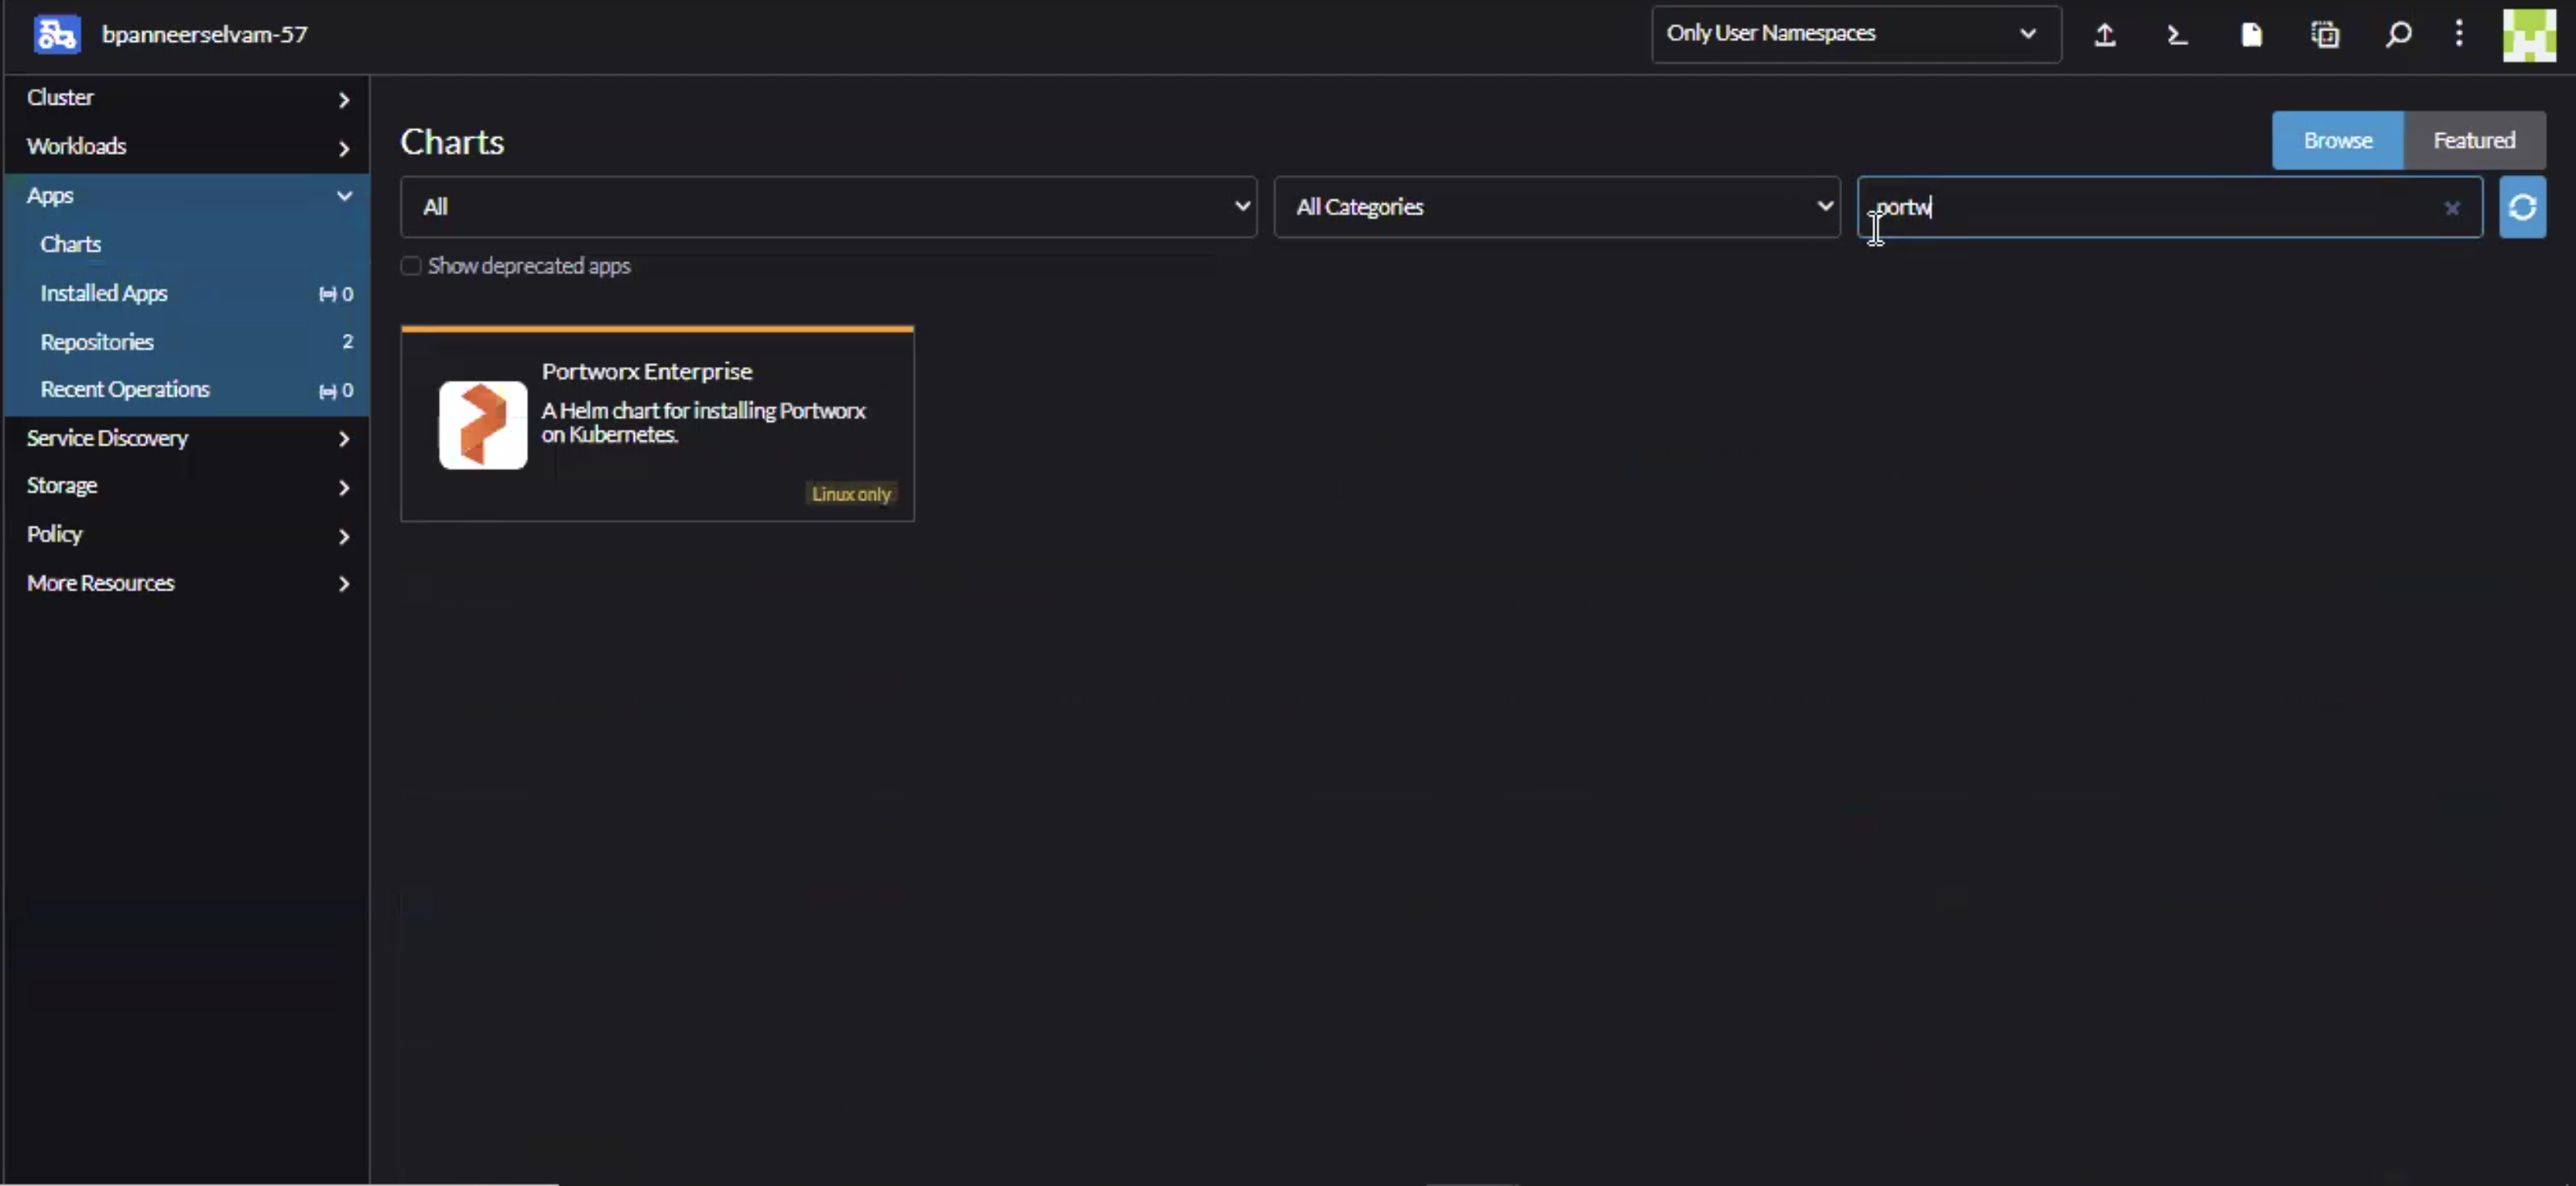
-
Select the Portworx Enterprise chart
Select Portworx Enterprise in the search results, then select Install to start the installation process. -
Specify Namespace and customize Helm options
- Provide a Namespace (defaults to
portworx). - Select Next to proceed.
- Provide a Namespace (defaults to
-
Configure the installation
- Adjust configuration values as needed for your environment.
- Choose option Edit YAML to customize further if required.
- Use Compare changes to review and validate your modifications.
- Select Next when satisfied.
For additional details on the configurable parameters, refer to the Portworx enterprise Helm charts reference.
-
Finalize and install
Make any final adjustments in the Helm configuration step, then select Install to begin the deployment of Portworx enterprise on your SUSE Rancher cluster.
Verify Portworx Pod Status
Enter the following command to list and filter the results for Portworx pods and specify the namespace where you have deployed Portworx:
kubectl get pods -n <px-namespace> -o wide | grep -e portworx -e px
NAME                                                    READY   STATUS    RESTARTS         AGE     IP                NODE                   NOMINATED NODE   READINESS GATES
portworx-api-774c2                                      1/1     Running   0                2m55s   192.168.121.196   username-k8s1-node0    <none>           <none>
portworx-api-t4lf9                                      1/1     Running   0                2m55s   192.168.121.99    username-k8s1-node1    <none>           <none>
portworx-api-dvw64                                      1/1     Running   0                2m55s   192.168.121.99    username-k8s1-node2    <none>           <none>
portworx-kvdb-94bpk                                     1/1     Running   0                4s      192.168.121.196   username-k8s1-node0    <none>           <none>
portworx-kvdb-8b67l                                     1/1     Running   0                10s     192.168.121.196   username-k8s1-node1    <none>           <none>
portworx-kvdb-fj72p                                     1/1     Running   0                30s     192.168.121.196   username-k8s1-node2    <none>           <none>
portworx-operator-58967ddd6d-kmz6c                      1/1     Running   0                4m1s    10.244.1.99       username-k8s1-node0    <none>           <none>
prometheus-px-prometheus-0                              2/2     Running   0                2m41s   10.244.1.105      username-k8s1-node0    <none>           <none>
px-cluster-xxxxxxxx-xxxx-xxxx-xxxx-3e9bf3cd834d-9gs79   2/2     Running   0                2m55s   192.168.121.196   username-k8s1-node0    <none>           <none>
px-cluster-xxxxxxxx-xxxx-xxxx-xxxx-3e9bf3cd834d-vpptx   2/2     Running   0                2m55s   192.168.121.99    username-k8s1-node1    <none>           <none>
px-cluster-xxxxxxxx-xxxx-xxxx-xxxx-3e9bf3cd834d-bxmpn   2/2     Running   0                2m55s   192.168.121.191   username-k8s1-node2    <none>           <none>
px-csi-ext-868fcb9fc6-54bmc                             4/4     Running   0                3m5s    10.244.1.103      username-k8s1-node0    <none>           <none>
px-csi-ext-868fcb9fc6-8tk79                             4/4     Running   0                3m5s    10.244.1.102      username-k8s1-node2    <none>           <none>
px-csi-ext-868fcb9fc6-vbqzk                             4/4     Running   0                3m5s    10.244.3.107      username-k8s1-node1    <none>           <none>
px-prometheus-operator-59b98b5897-9nwfv                 1/1     Running   0                3m3s    10.244.1.104      username-k8s1-node0    <none>           <none>
Note the name of a px-cluster pod. You will run pxctl commands from these pods in Verify Portworx Cluster Status.
Verify Portworx Cluster Status
You can find the status of the Portworx cluster by running pxctl status commands from a pod.
Enter the following kubectl exec command, specifying the pod name you retrieved in Verify Portworx Pod Status:
kubectl exec <pod-name> -n <px-namespace> -- /opt/pwx/bin/pxctl status
Defaulted container "portworx" out of: portworx, csi-node-driver-registrar
Status: PX is operational
Telemetry: Disabled or Unhealthy
Metering: Disabled or Unhealthy
License: Trial (expires in 31 days)
Node ID: xxxxxxxx-xxxx-xxxx-xxxx-70c31d0f478e
    IP: 192.168.121.99
    Local Storage Pool: 1 pool
    POOL    IO_PRIORITY     RAID_LEVEL      USABLE  USED    STATUS  ZONE    REGION
    0       HIGH            raid0           3.0 TiB 10 GiB  Online  default default
    Local Storage Devices: 3 devices
    Device  Path            Media Type              Size            Last-Scan
    0:1     /dev/vdb        STORAGE_MEDIUM_MAGNETIC 1.0 TiB         14 Jul 22 22:03 UTC
    0:2     /dev/vdc        STORAGE_MEDIUM_MAGNETIC 1.0 TiB         14 Jul 22 22:03 UTC
    0:3     /dev/vdd        STORAGE_MEDIUM_MAGNETIC 1.0 TiB         14 Jul 22 22:03 UTC
    * Internal kvdb on this node is sharing this storage device /dev/vdc  to store its data.
    total           -       3.0 TiB
    Cache Devices:
        * No cache devices
Cluster Summary
    Cluster ID: px-cluster-xxxxxxxx-xxxx-xxxx-xxxx-3e9bf3cd834d
    Cluster UUID: xxxxxxxx-xxxx-xxxx-xxxx-6f3fd5522eae
    Scheduler: kubernetes
    Nodes: 3 node(s) with storage (3 online)
    IP              ID                                      SchedulerNodeName       Auth            StorageNode     Used    Capacity        Status  StorageStatus       Version         Kernel                  OS
    192.168.121.196 xxxxxxxx-xxxx-xxxx-xxxx-fad8c65b8edc    username-k8s1-node0      Disabled        Yes             10 GiB  3.0 TiB         Online  Up 2.11.0-81faacc   3.10.0-1127.el7.x86_64  CentOS Linux 7 (Core)
    192.168.121.99  xxxxxxxx-xxxx-xxxx-xxxx-70c31d0f478e    username-k8s1-node1      Disabled        Yes             10 GiB  3.0 TiB         Online  Up (This node)      2.11.0-81faacc  3.10.0-1127.el7.x86_64  CentOS Linux 7 (Core)
    192.168.121.191 xxxxxxxx-xxxx-xxxx-xxxx-19d45b4c541a    username-k8s1-node2      Disabled        Yes             10 GiB  3.0 TiB         Online  Up  2.11.0-81faacc  3.10.0-1127.el7.x86_64  CentOS Linux 7 (Core)
Global Storage Pool
    Total Used      :  30 GiB
    Total Capacity  :  9.0 TiB
Status displays PX is operational when the cluster is running as expected. If the cluster is using the PX-StoreV2 datastore, the StorageNode entries for each node displays Yes(PX-StoreV2).
Verify Portworx Pool Status
This procedure is applicable for clusters with PX-StoreV2 datastore.
Run the following command to view the Portworx drive configurations for your pod:
kubectl exec <px-pod> -n <px-namespace> -- /opt/pwx/bin/pxctl service pool show
Defaulted container "portworx" out of: portworx, csi-node-driver-registrar
PX drive configuration:
Pool ID: 0
    Type:  PX-StoreV2
    UUID:  58ab2e3f-a22e-xxxx-xxxx-xxxxxxxxxxxx
    IO Priority:  HIGH
    Labels:  kubernetes.io/arch=amd64,kubernetes.io/hostname=username-vms-silver-sight-3,kubernetes.io/os=linux,medium=STORAGE_MEDIUM_SSD,beta.kubernetes.io/arch=amd64,beta.kubernetes.io/os=linux,iopriority=HIGH
    Size: 25 GiB
    Status: Online
    Has metadata:  No
    Balanced:  Yes
    Drives:
    0: /dev/sda, Total size 32 GiB, Online
    Cache Drives:
    No Cache drives found in this pool
Metadata  Device:
    1: /dev/sdd, STORAGE_MEDIUM_SSD
The output Type: PX-StoreV2 ensures that the pod uses the PX-StoreV2 datastore.
Verify pxctl Cluster Provision Status
-
Access the Portworx CLI.
-
Run the following command to find the storage cluster:
kubectl -n <px-namespace> get storageclusterNAME CLUSTER UUID STATUS VERSION AGE
px-cluster-xxxxxxxx-xxxx-xxxx-xxxx-3e9bf3cd834d xxxxxxxx-xxxx-xxxx-xxxx-6f3fd5522eae Online 2.11.0 10mThe status must display the cluster is
Online. -
Run the following command to find the storage nodes:
kubectl -n <px-namespace> get storagenodesNAME ID STATUS VERSION AGE
username-k8s1-node0 xxxxxxxx-xxxx-xxxx-xxxx-fad8c65b8edc Online 2.11.0-81faacc 11m
username-k8s1-node1 xxxxxxxx-xxxx-xxxx-xxxx-70c31d0f478e Online 2.11.0-81faacc 11m
username-k8s1-node2 xxxxxxxx-xxxx-xxxx-xxxx-19d45b4c541a Online 2.11.0-81faacc 11mThe status must display the nodes are
Online. -
Verify the Portworx cluster provision status by running the following command.
Specify the pod name you retrieved in Verify Portworx Pod Status.kubectl exec <px-pod> -n <px-namespace> -- /opt/pwx/bin/pxctl cluster provision-statusNODE NODE STATUS POOL POOL STATUS IO_PRIORITY SIZE AVAILABLE USED PROVISIONED ZONE REGION RACK
0c99e1f2-9d49-xxxx-xxxx-xxxxxxxxxxxx Up 0 ( 8ec9e6aa-7726-xxxx-xxxx-xxxxxxxxxxxx ) Online HIGH 32 GiB 32 GiB 33 MiB 0 B default default default
1e89102f-0510-xxxx-xxxx-xxxxxxxxxxxx Up 0 ( 06fcc73a-7e2f-xxxx-xxxx-xxxxxxxxxxxx ) Online HIGH 32 GiB 32 GiB 33 MiB 0 B default default default
24508311-e2fe-xxxx-xxxx-xxxxxxxxxxxx Up 0 ( 58ab2e3f-a22e-xxxx-xxxx-xxxxxxxxxxxx ) Online HIGH 32 GiB 32 GiB 33 MiB 0 B default default default
What to do next
Create a PVC. For more information, see Create your first PVC.