Configure the OpenShift monitoring solution
This article provides instructions for configuring monitoring for Portworx deployments on OpenShift. With these OpenShift versions 4.12 or newer, Portworx uses OpenShift’s Prometheus deployment for monitoring, rather than deploying its own. Perform the steps below to integrate the following with OpenShift’s Prometheus deployment:
- Portworx
- Autopilot
- Grafana
Prerequisites
- Portworx Operator version 23.10.3 or newer.
- Autopilot version 1.3.13 or newer.
Fetch the Thanos Querier route host
Fetch the Thanos route host, which is part of the OpenShift monitoring stack:
oc get route thanos-querier -n openshift-monitoring -o json | jq -r '.spec.host'
thanos-querier-openshift-monitoring.tp-nextpx-iks-catalog-pl-80e1e1cd66534115bf44691bf8f01a6b-0000.us-south.containers.appdomain.cloud
Save this value for later, you'll use it to configure Autopilot and Grafana using the route host to enable access to Prometheus's statistics.
Configure Autopilot
When configuring Autopilot, the use of self-signed certificates for the default Ingress is supported in on-premises environments.
Edit the Autopilot spec within the Portworx manifest. Include the Thanos Querier host URL you retrieved in the step above. Replace <THANOS-QUERIER-HOST> with the actual host URL:
spec:
  autopilot:
    enabled: true
    image: <autopilot-image>
    providers:
    - name: default
      params:
        url: https://<THANOS-QUERIER-HOST>
      type: prometheus
This configuration tells Autopilot to use the OpenShift Prometheus deployment (via Thanos Querier) for metrics and monitoring.
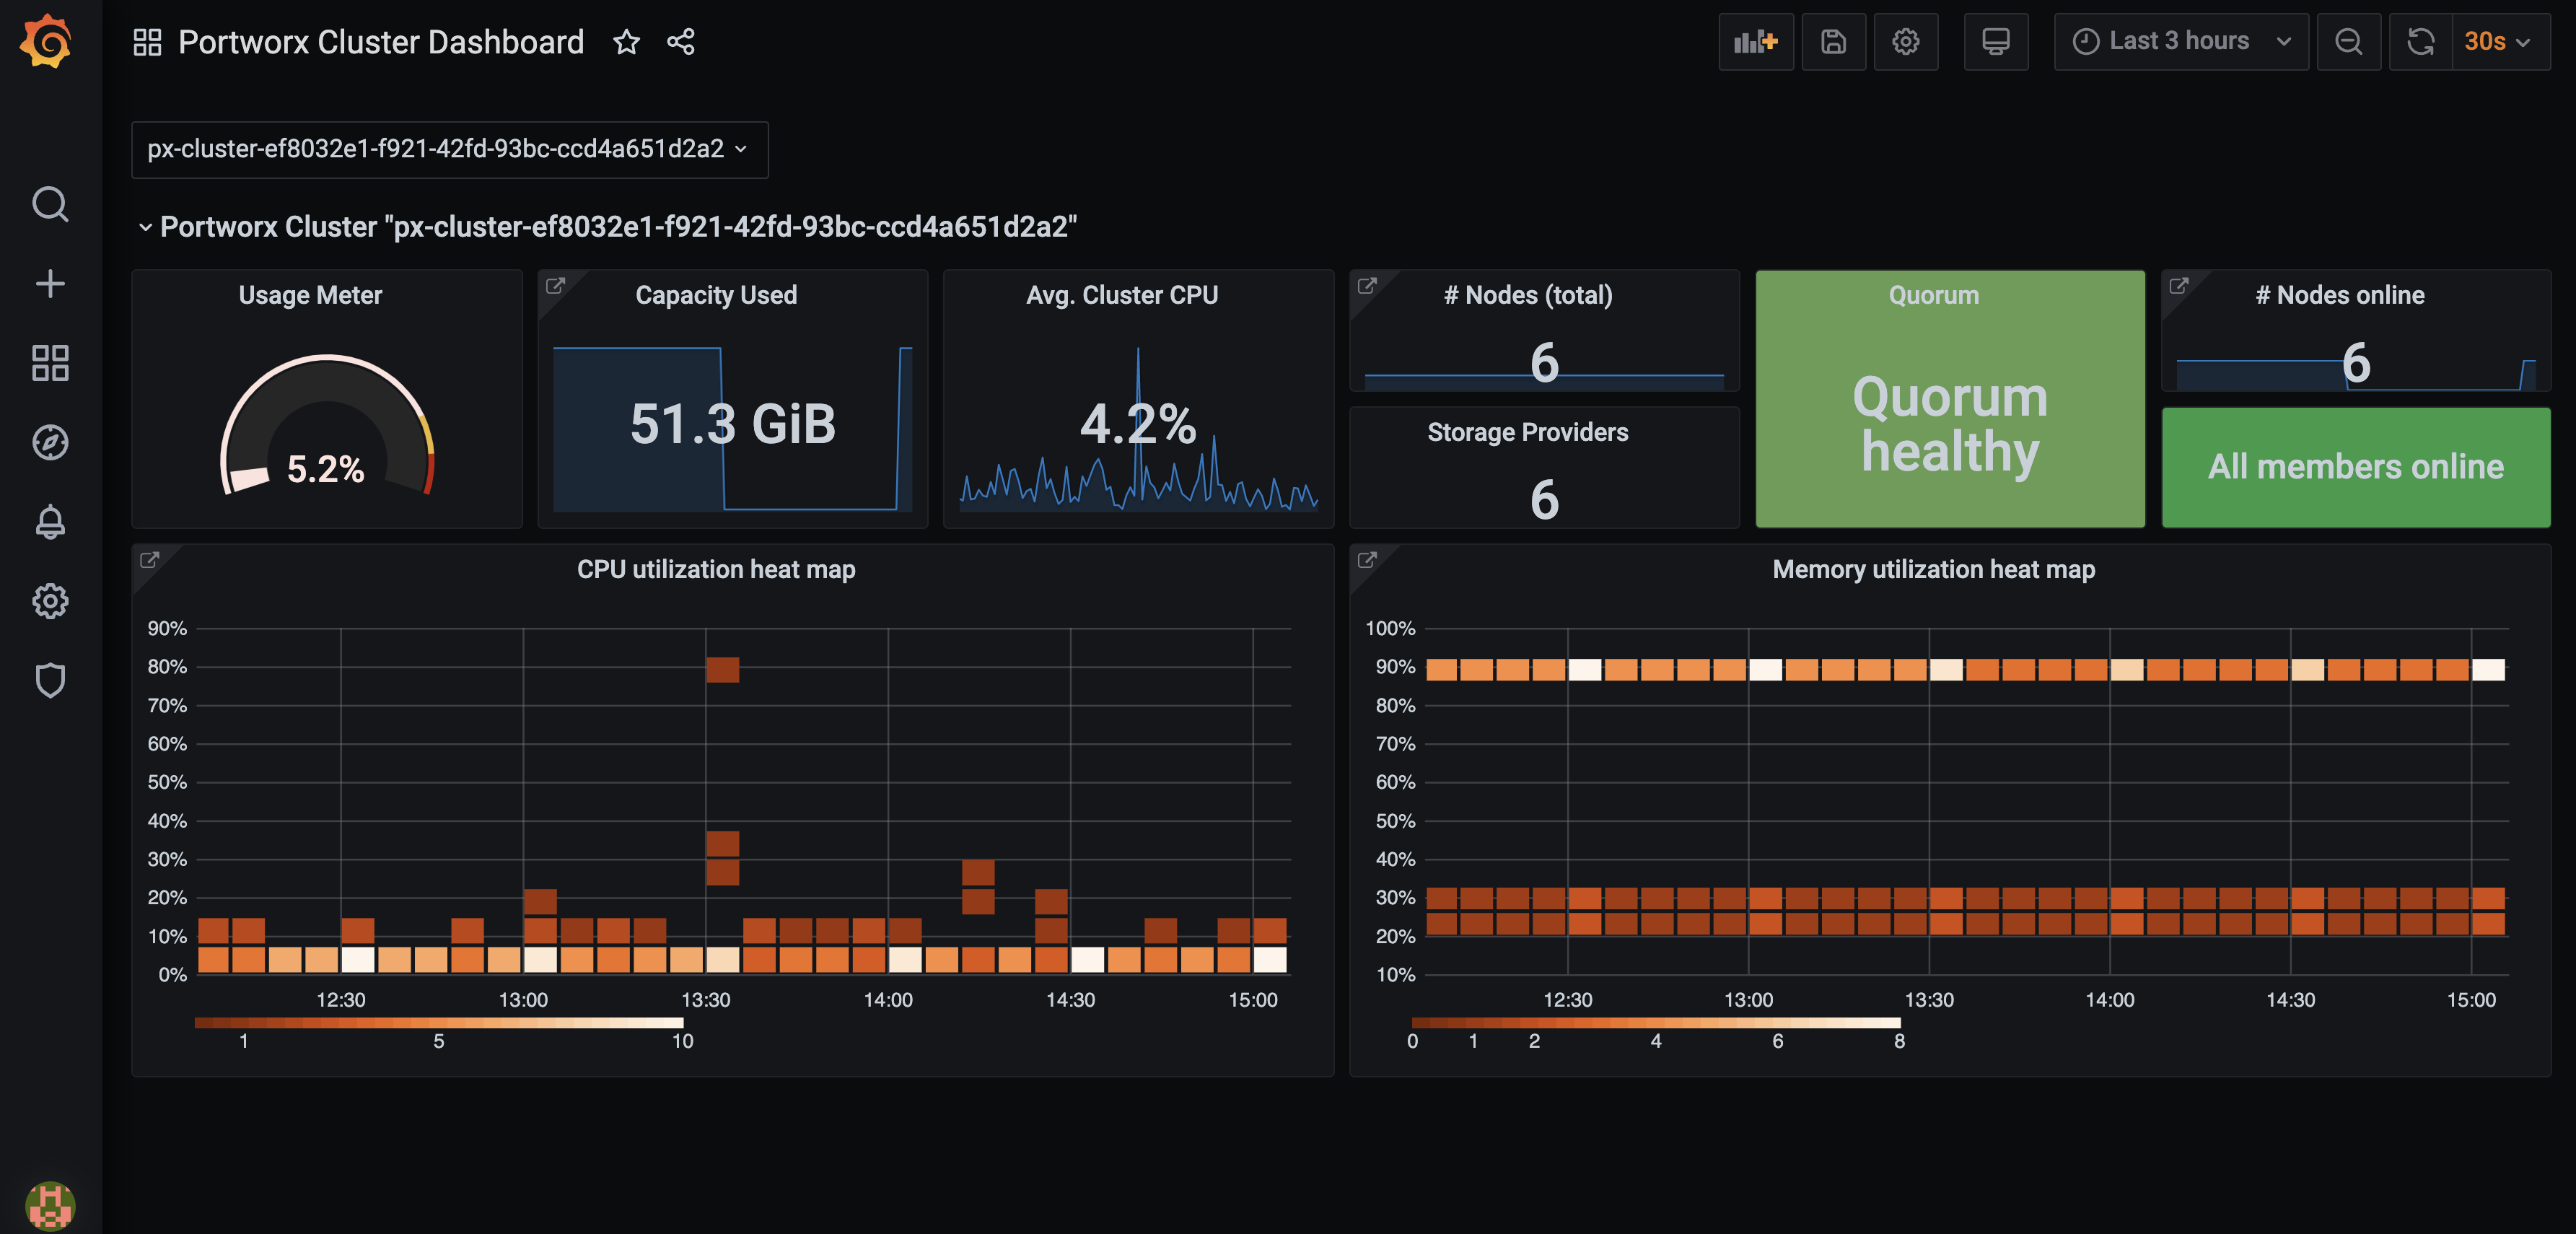
Configure Grafana
You can connect to Prometheus using Grafana to visualize your data. Grafana is a multi-platform open source analytics and interactive visualization web application. It provides charts, graphs, and alerts.
Enter the following commands to download the Grafana dashboard and datasource configuration files:
curl -O https://docs.portworx.com/samples/portworx-enterprise/k8s/pxc/grafana-dashboard-config.yaml% Total % Received % Xferd Average Speed Time Time Time Current
Dload Upload Total Spent Left Speed
100 211 100 211 0 0 596 0 --:--:-- --:--:-- --:--:-- 596curl -O https://docs.portworx.com/samples/portworx-enterprise/k8s/pxc/grafana-datasource-ocp.yaml% Total % Received % Xferd Average Speed Time Time Time Current
Dload Upload Total Spent Left Speed
100 1625 100 1625 0 0 4456 0 --:--:-- --:--:-- --:--:-- 4464Create the
grafanaservice account:oc apply -f https://docs.portworx.com/samples/portworx-enterprise/k8s/pxc/grafana-service-account.yamlThe
grafanaservice account was created alongside the Grafana instance. Grant it thecluster-monitoring-viewcluster role:oc -n kube-system adm policy add-cluster-role-to-user cluster-monitoring-view -z grafanaThe bearer token for this service account is used to authenticate access to OpenShift Prometheus. Create a service account token secret:
oc -n kube-system create token grafana --duration=8760hModify the
grafana-datasource-ocp.yamlfile:On the
url: https://<THANOS_QUERIER_HOST>line, replace<THANOS_QUERIER_HOST>with the URL you retrieved in the Fetch the Thanos Querier route host section:On the
httpHeaderValue1: 'Bearer <BEARER_TOKEN>'line, replace<BEARER_TOKEN>with the bearer token value you created in the step above.
Create a configmap for the dashboard and data source:
oc -n kube-system create configmap grafana-dashboard-config --from-file=grafana-dashboard-config.yamloc -n kube-system create configmap grafana-source-config --from-file=grafana-datasource-ocp.yamlDownload and install Grafana dashboards using the following commands:
curl "https://docs.portworx.com/samples/portworx-enterprise/k8s/pxc/portworx-cluster-dashboard.json" -o portworx-cluster-dashboard.json && \
curl "https://docs.portworx.com/samples/portworx-enterprise/k8s/pxc/portworx-node-dashboard.json" -o portworx-node-dashboard.json && \
curl "https://docs.portworx.com/samples/portworx-enterprise/k8s/pxc/portworx-volume-dashboard.json" -o portworx-volume-dashboard.json && \
curl "https://docs.portworx.com/samples/portworx-enterprise/k8s/pxc/portworx-performance-dashboard.json" -o portworx-performance-dashboard.json && \
curl "https://docs.portworx.com/samples/portworx-enterprise/k8s/pxc/portworx-etcd-dashboard.json" -o portworx-etcd-dashboard.json
oc -n kube-system create configmap grafana-dashboards \
--from-file=portworx-cluster-dashboard.json \
--from-file=portworx-performance-dashboard.json \
--from-file=portworx-node-dashboard.json \
--from-file=portworx-volume-dashboard.json \
--from-file=portworx-etcd-dashboard.jsonEnter the following command to download and install the Grafana YAML file:
oc apply -f https://docs.portworx.com/samples/portworx-enterprise/k8s/pxc/grafana-ocp.yamlVerify if the Grafana pod is running using the following command:
oc -n kube-system get pods | grep -i grafanagrafana-7d789d5cf9-bklf2 1/1 Running 0 3m12sAccess Grafana by setting up port forwarding and browsing to the specified port. In this example, port forwarding is provided for ease of access to the Grafana service from your local machine using the port 3000:
oc -n kube-system port-forward service/grafana 3000:3000Navigate to Grafana by browsing to
http://localhost:3000.Enter the default credentials to log in.
login:
adminpassword:
admin