Configure the Portworx monitoring solution
Prerequisites
- Portworx version 2.11 or later
- Portworx Operator version 1.9.0 or later
Monitoring function
You can use the following technologies to monitor your Portworx cluster:
- Prometheus to collect data
- Alertmanager to provide notifications
- Grafana to visualize your data
Verify monitoring using Prometheus
You can monitor your Portworx cluster using Prometheus. Portworx deploys Prometheus by default, but you can verify the deployment:
Verify that Prometheus pods are running by entering the following
kubectl get podscommand in the namespace where you deployed Portworx. For example:kubectl -n kube-system get pods -A | grep -i prometheuskube-system prometheus-px-prometheus-0 2/2 Running 0 59m
kube-system px-prometheus-operator-59b98b5897-9nwfv 1/1 Running 0 60mVerify that the Prometheus
px-prometheusandprometheus operatedservices exist by entering the following command:kubectl -n kube-system get service | grep -i prometheusprometheus-operated ClusterIP None <none> 9090/TCP 63m
px-prometheus ClusterIP 10.99.61.133 <none> 9090/TCP 63m
Set up Alertmanager
Prometheus Alertmanager handles alerts sent from the Prometheus server based on rules you set. If any Prometheus rule is triggered, Alertmanager sends a corresponding notification to the specified receivers. You can configure these receivers using an Alertmanager config file. Perform the following steps to configure and enable Alertmanager:
Create a valid Alertmanager configuration file and name it
alertmanager.yaml. The following is a sample for Alertmanager, and the settings used in your environment may be different:global:
# The smarthost and SMTP sender used for mail notifications.
smtp_smarthost: 'smtp.gmail.com:587'
smtp_from: 'abc@test.com'
smtp_auth_username: "abc@test.com"
smtp_auth_password: 'xyxsy'
route:
group_by: [Alertname]
# Send all notifications to me.
receiver: email-me
receivers:
- name: email-me
email_configs:
- to: abc@test.com
from: abc@test.com
smarthost: smtp.gmail.com:587
auth_username: "abc@test.com"
auth_identity: "abc@test.com"
auth_password: "abc@test.com"Create a secret called
alertmanager-portworxin the same namespace as your StorageCluster object:kubectl -n kube-system create secret generic alertmanager-portworx --from-file=alertmanager.yaml=alertmanager.yamlEdit your StorageCluster object to enable Alertmanager:
kubectl -n kube-system edit stc <px-cluster-name>apiVersion: core.libopenstorage.org/v1
kind: StorageCluster
metadata:
name: portworx
namespace: kube-system
monitoring:
prometheus:
enabled: true
exportMetrics: true
alertManager:
enabled: trueVerify that the Alertmanager pods are running using the following command:
kubectl -n kube-system get pods | grep -i alertmanageralertmanager-portworx-0 2/2 Running 0 4m9s
alertmanager-portworx-1 2/2 Running 0 4m9s
alertmanager-portworx-2 2/2 Running 0 4m9snoteTo view the complete list of out-of-the-box default rules, see step 7 below.
Access the Alertmanager UI
To access the Alertmanager UI and view the Alertmanager Status and alerts, you need to set up port forwarding and browse to the specified port. In this example, port forwarding is provided for ease of access to the Alertmanager service from your local machine using the port 9093.
Set up port forwarding:
kubectl -n kube-system port-forward service/alertmanager-portworx --address=<masternodeIP> 9093:9093Access Prometheus UI by browsing to
http://<masternodeIP>:9093/#/status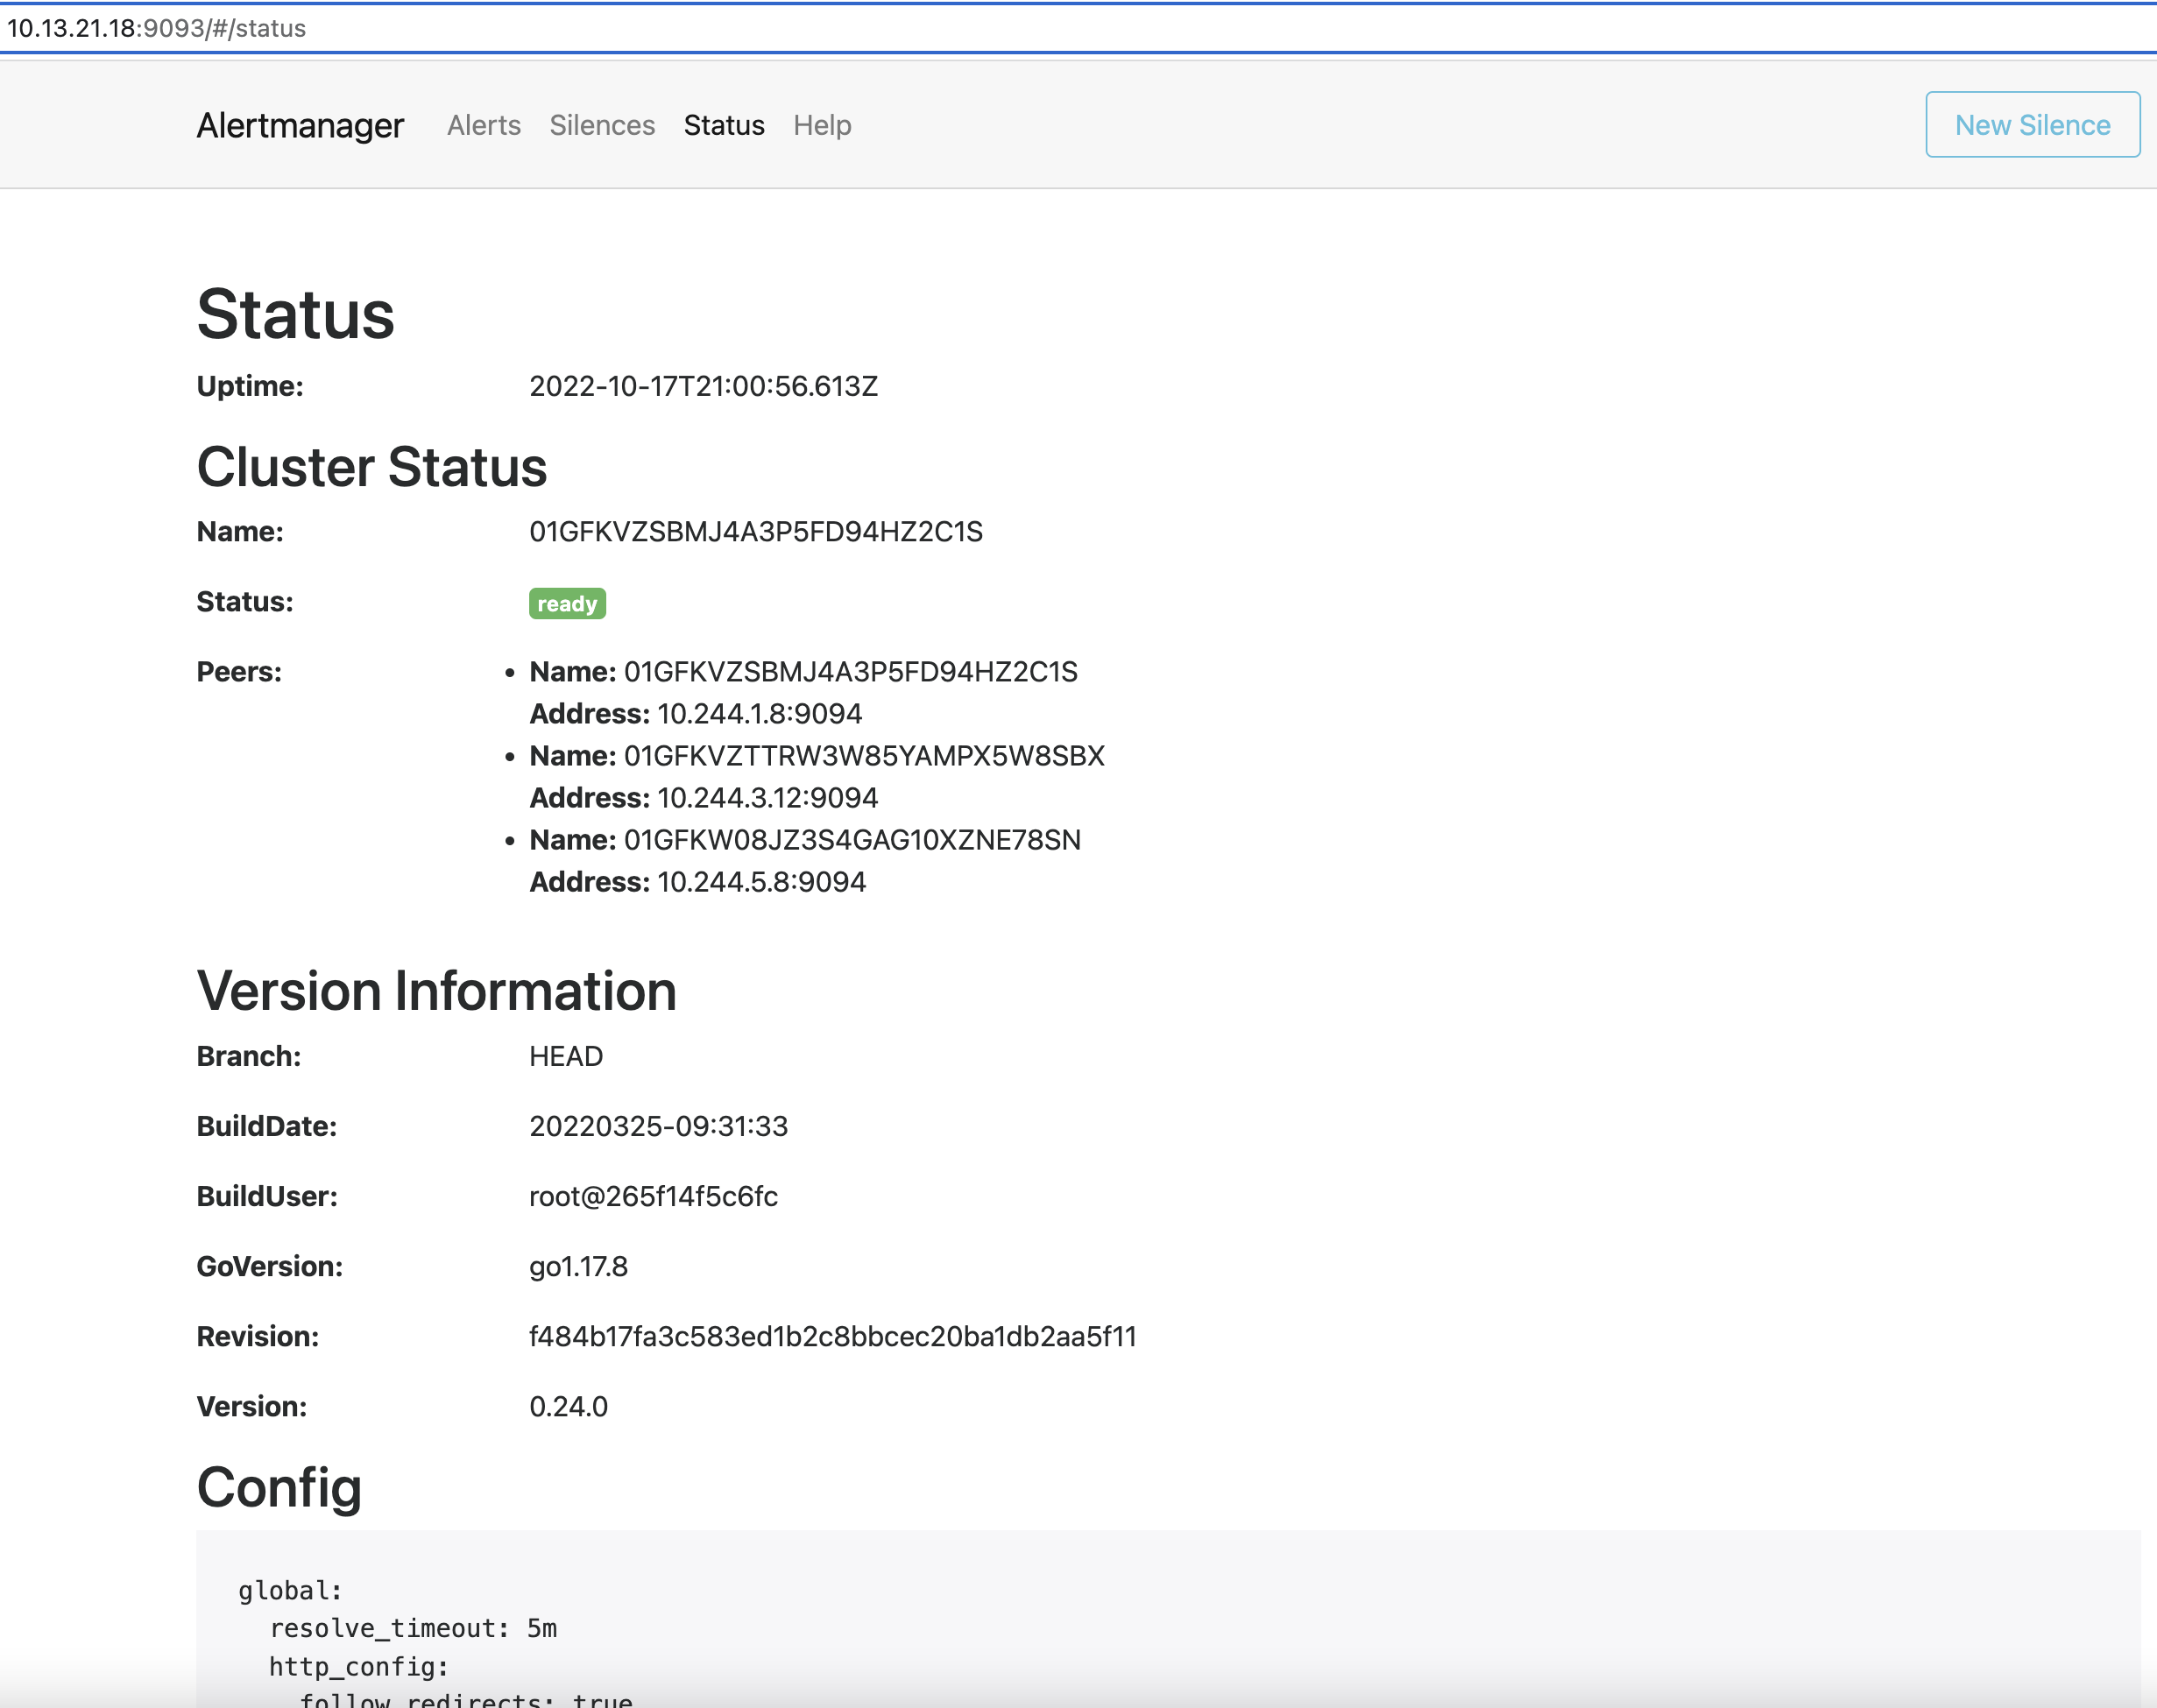
Portworx Central on-premises includes Grafana and Portworx dashboards natively, which you can use to monitor your Portworx cluster. Refer to the Portworx Central documentation for further details.
Access the Prometheus UI
To access the Prometheus UI to view Status, Graph and default Alerts, you also need to set up port forwarding and browse to the specified port. In this example, Port forwarding is provided for ease of access to the Prometheus UI service from your local machine using the port 9090.
Set up port forwarding:
kubectl -n kube-system port-forward service/px-prometheus 9090:9090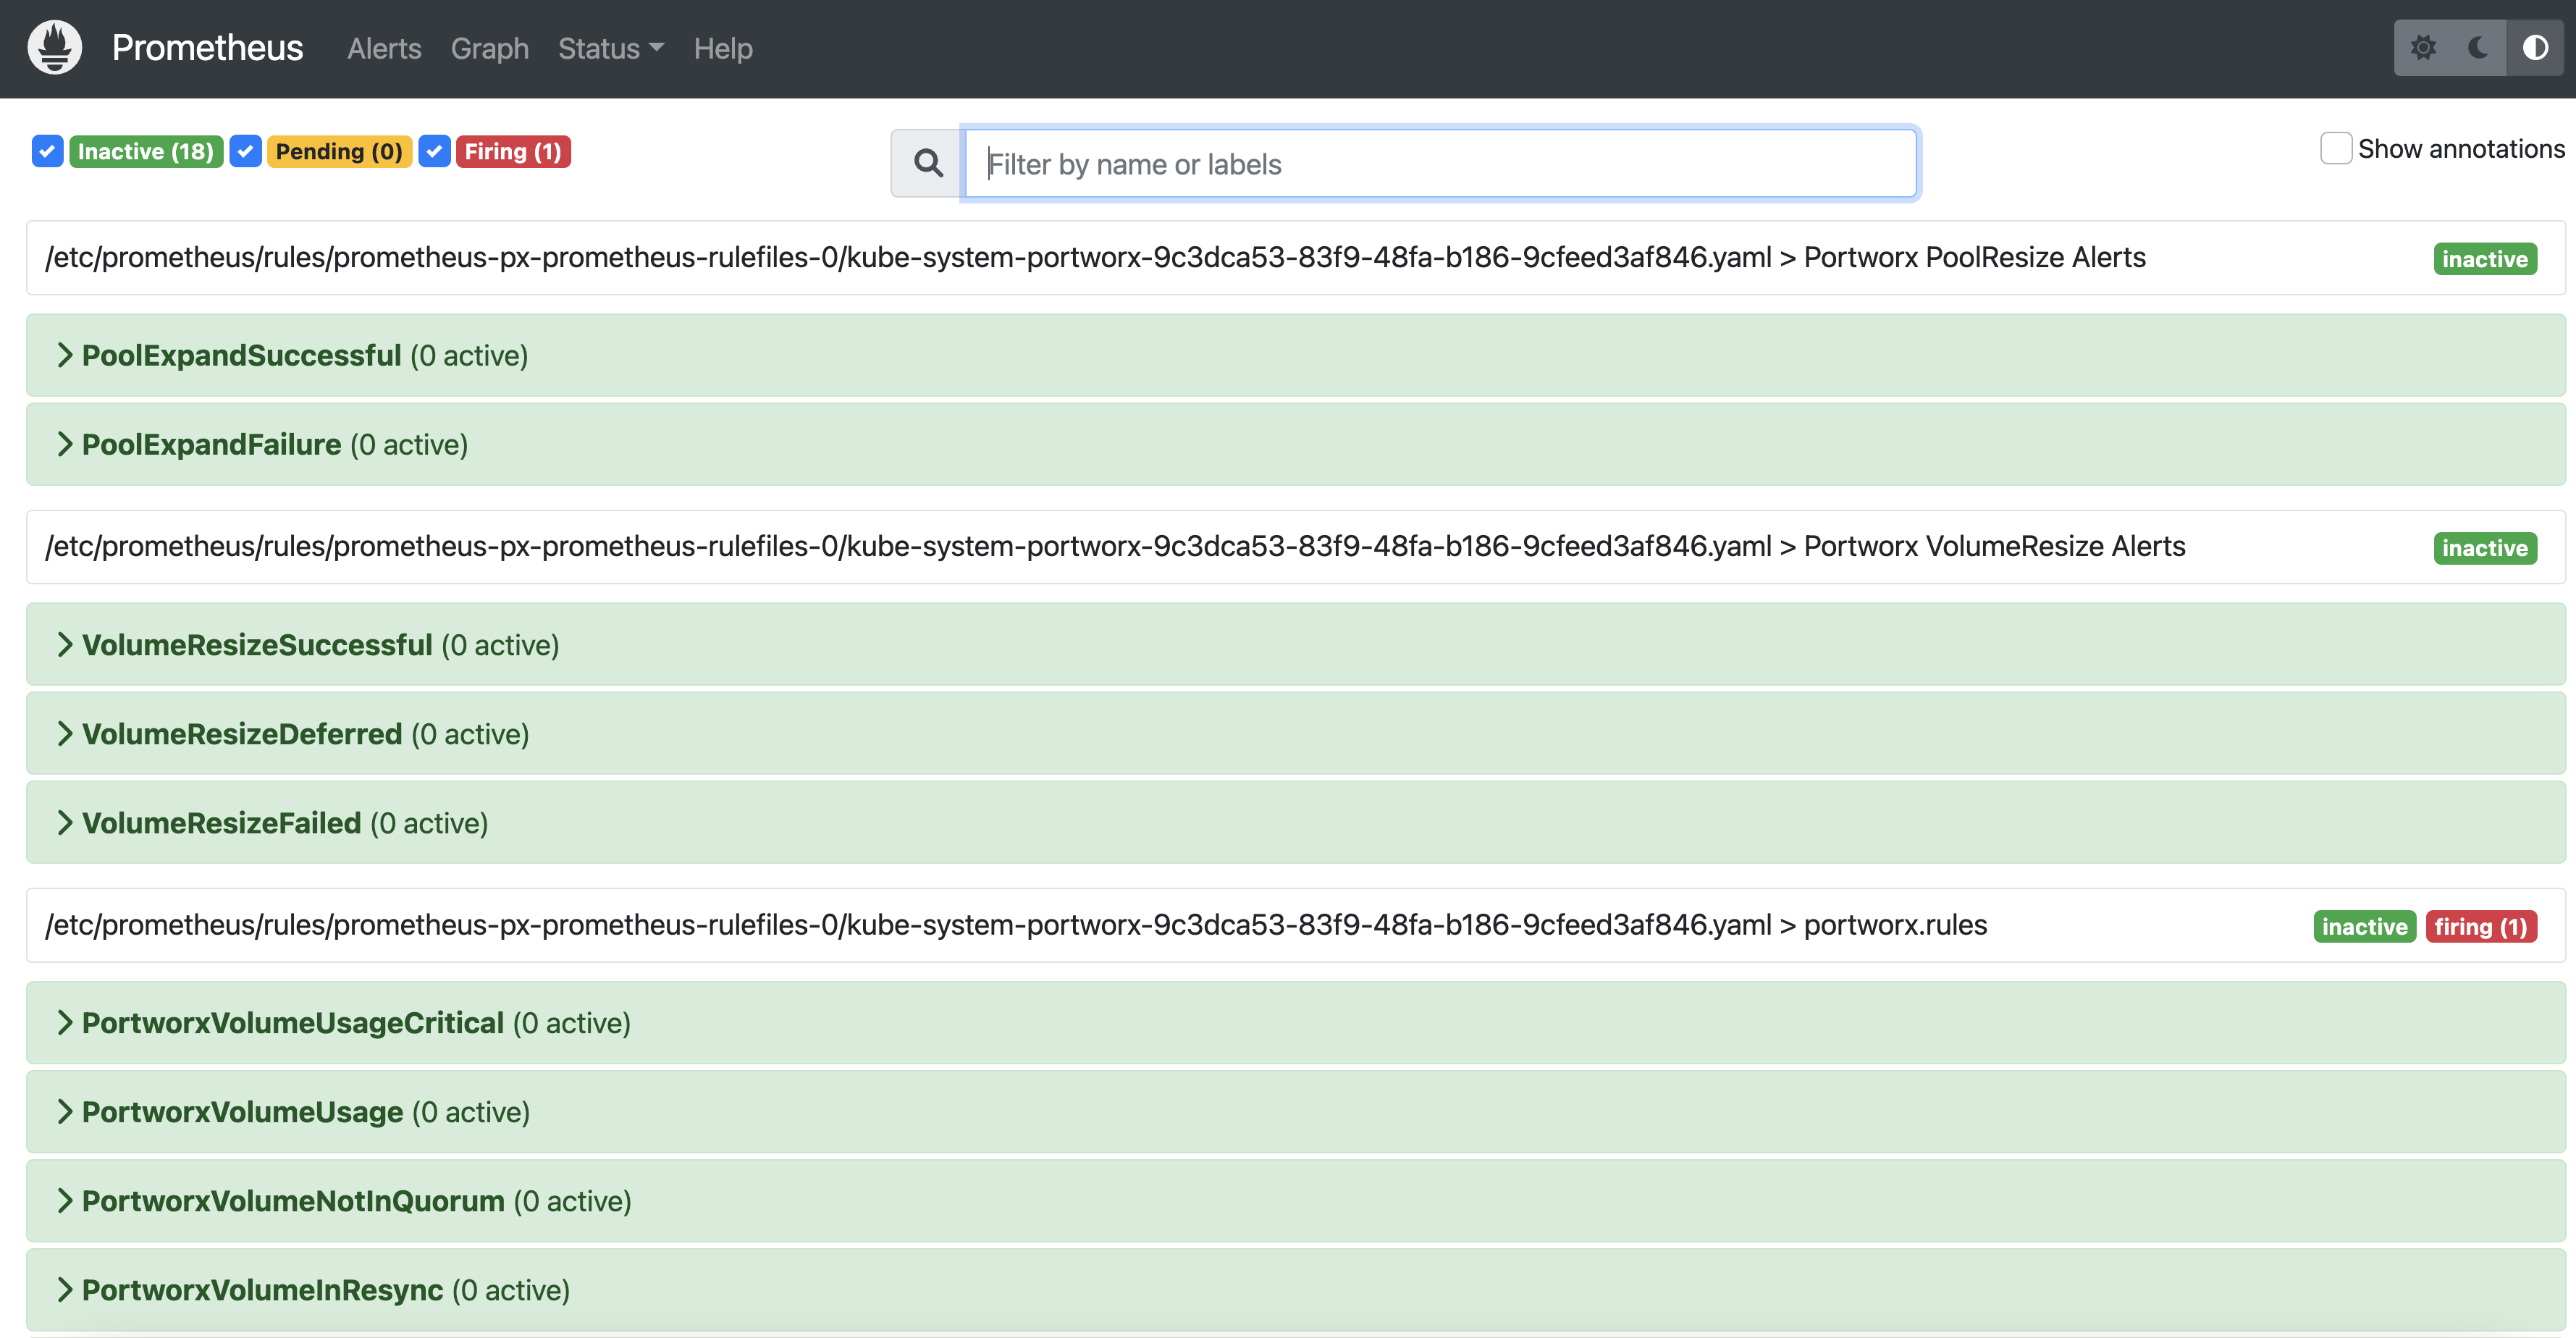
Access the Prometheus UI by browsing to
http://localhost:9090/alerts.
View provided Prometheus rules
To view the complete list of out-of-the-box default rules used for event notifications, perform the following steps.
Get the Prometheus rules:
kubectl -n kube-system get prometheusrulesNAME AGE
portworx 46dSave the Prometheus rules to a YAML file:
kubectl -n kube-system get prometheusrules portworx -o yaml > prometheusrules.yamlView the contents of the file:
cat prometheusrules.yaml
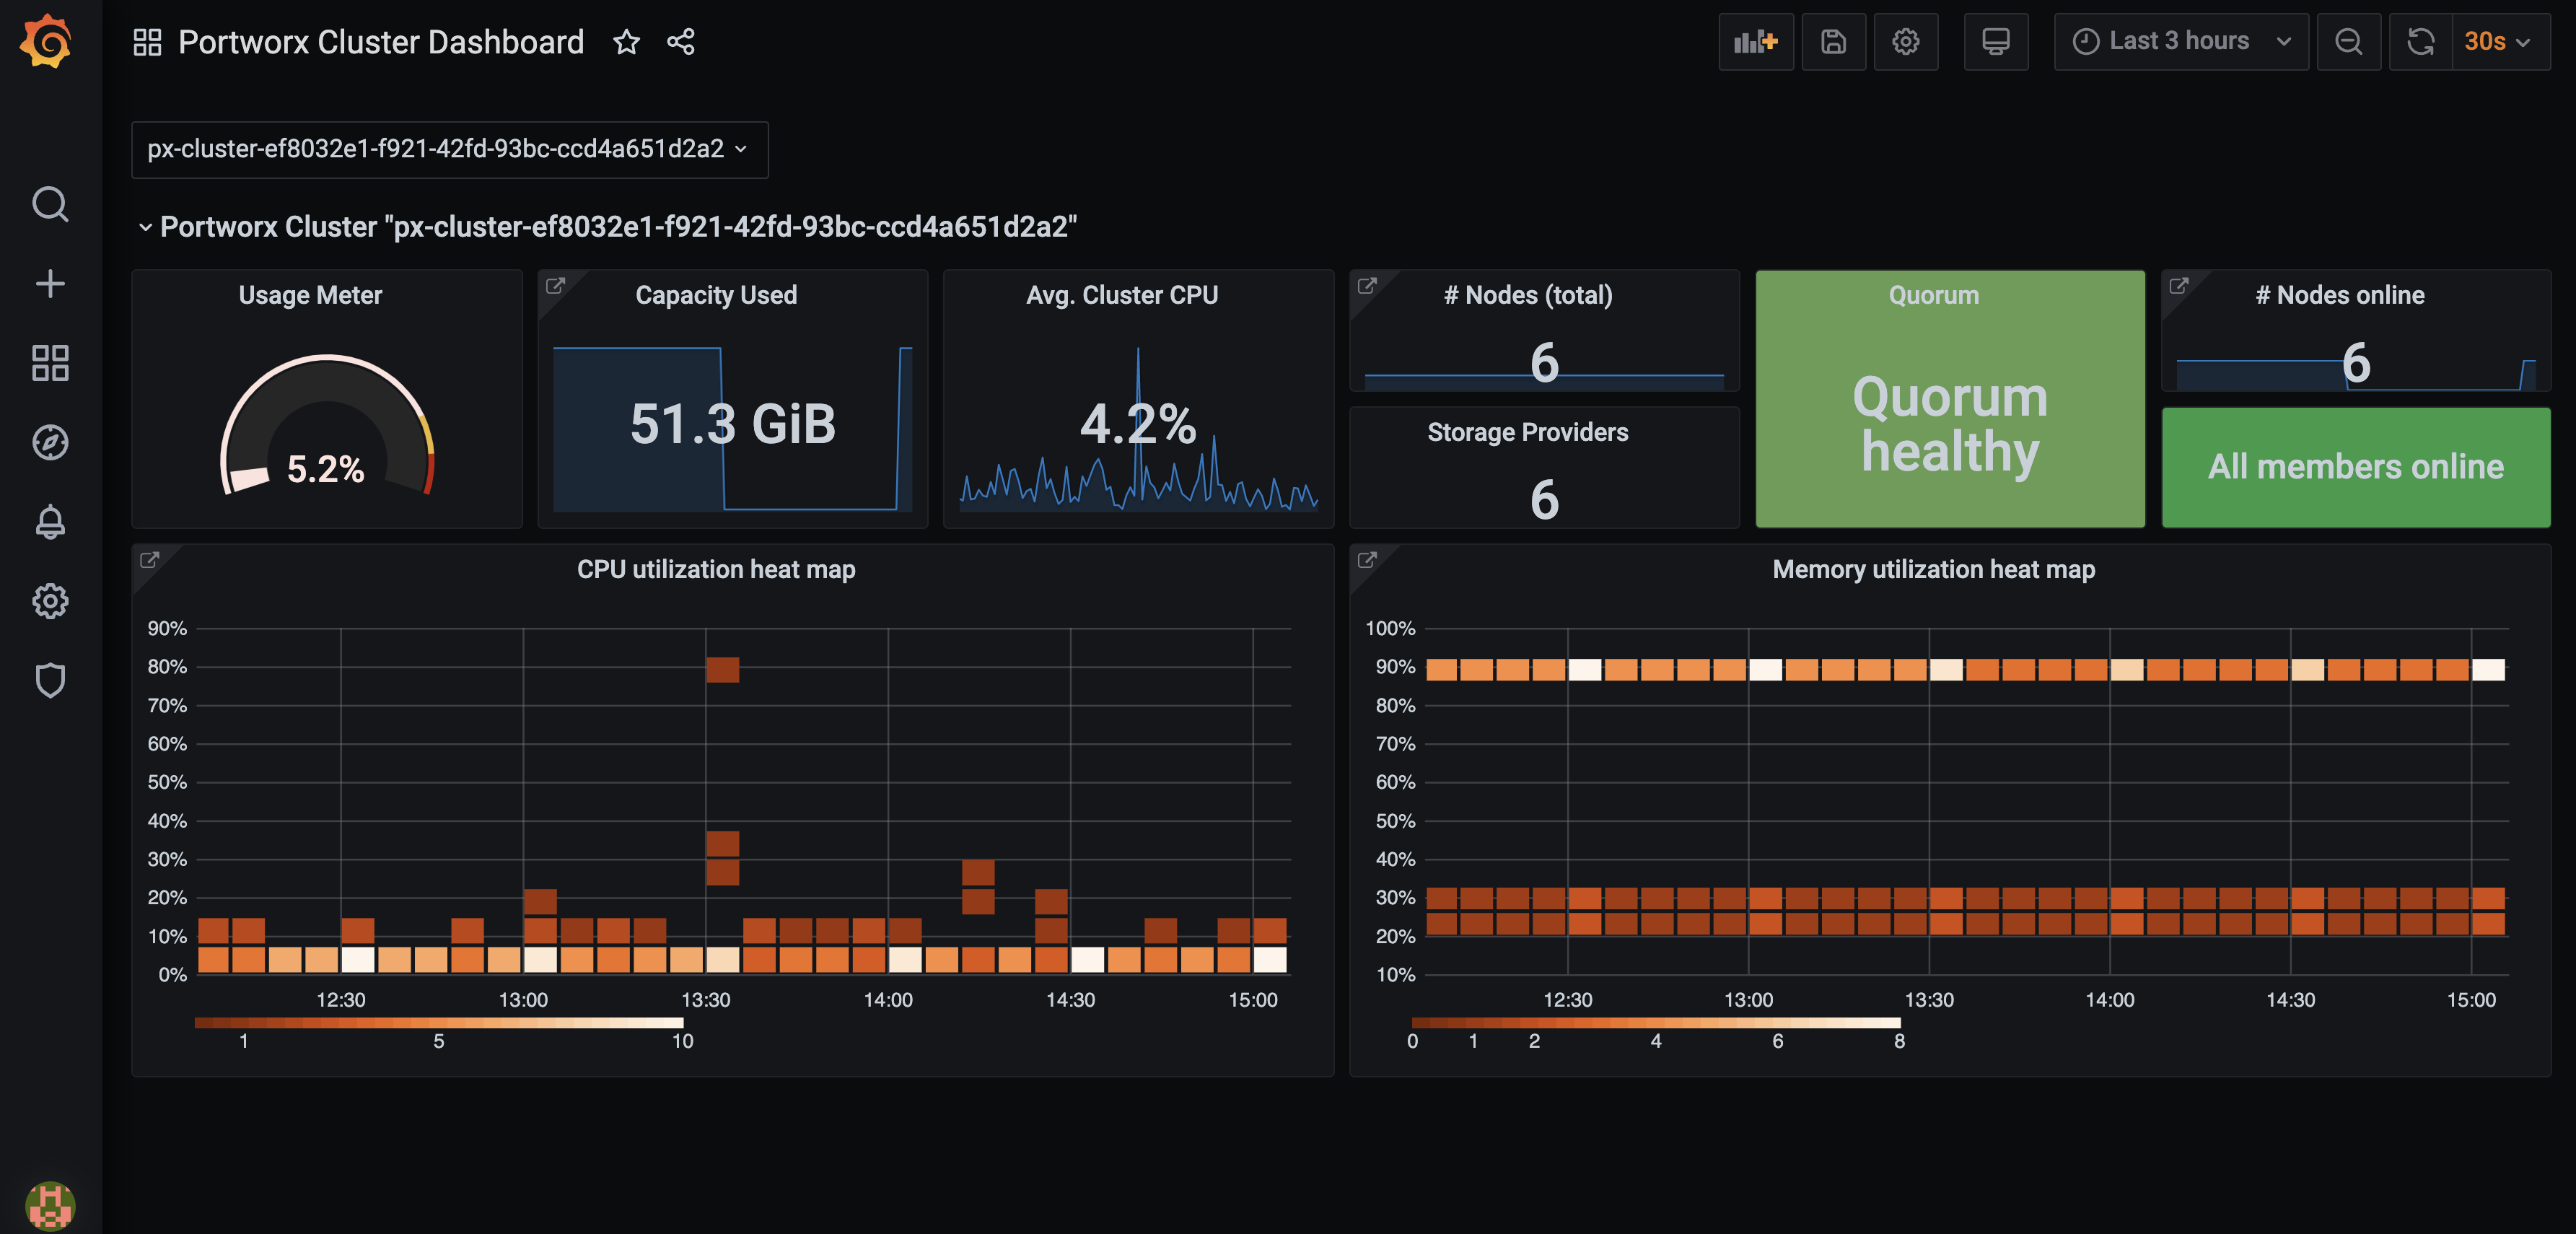
Configure Grafana
You can connect to Prometheus using Grafana to visualize your data. Grafana is a multi-platform open source analytics and interactive visualization web application. It provides charts, graphs, and alerts.
Enter the following commands to download the Grafana dashboard and datasource configuration files:
curl -O https://docs.portworx.com/samples/portworx-enterprise/k8s/pxc/grafana-dashboard-config.yaml% Total % Received % Xferd Average Speed Time Time Time Current
Dload Upload Total Spent Left Speed
100 211 100 211 0 0 596 0 --:--:-- --:--:-- --:--:-- 596curl -O https://docs.portworx.com/samples/portworx-enterprise/k8s/pxc/grafana-datasource.yaml% Total % Received % Xferd Average Speed Time Time Time Current
Dload Upload Total Spent Left Speed
100 1625 100 1625 0 0 4456 0 --:--:-- --:--:-- --:--:-- 4464Create a configmap for the dashboard and data source:
kubectl -n kube-system create configmap grafana-dashboard-config --from-file=grafana-dashboard-config.yamlkubectl -n kube-system create configmap grafana-source-config --from-file=grafana-datasource.yamlDownload and install Grafana dashboards using the following commands:
curl "https://docs.portworx.com/samples/portworx-enterprise/k8s/pxc/portworx-cluster-dashboard.json" -o portworx-cluster-dashboard.json && \
curl "https://docs.portworx.com/samples/portworx-enterprise/k8s/pxc/portworx-node-dashboard.json" -o portworx-node-dashboard.json && \
curl "https://docs.portworx.com/samples/portworx-enterprise/k8s/pxc/portworx-volume-dashboard.json" -o portworx-volume-dashboard.json && \
curl "https://docs.portworx.com/samples/portworx-enterprise/k8s/pxc/portworx-performance-dashboard.json" -o portworx-performance-dashboard.json && \
curl "https://docs.portworx.com/samples/portworx-enterprise/k8s/pxc/portworx-etcd-dashboard.json" -o portworx-etcd-dashboard.json
kubectl -n kube-system create configmap grafana-dashboards \
--from-file=portworx-cluster-dashboard.json \
--from-file=portworx-performance-dashboard.json \
--from-file=portworx-node-dashboard.json \
--from-file=portworx-volume-dashboard.json \
--from-file=portworx-etcd-dashboard.jsonEnter the following command to download and install the Grafana YAML file:
kubectl apply -f https://docs.portworx.com/samples/portworx-enterprise/k8s/pxc/grafana.yamlVerify if the Grafana pod is running using the following command:
kubectl -n kube-system get pods | grep -i grafanagrafana-7d789d5cf9-bklf2 1/1 Running 0 3m12sAccess Grafana by setting up port forwarding and browsing to the specified port. In this example, port forwarding is provided for ease of access to the Grafana service from your local machine using the port 3000:
kubectl -n kube-system port-forward service/grafana 3000:3000Navigate to Grafana by browsing to
http://localhost:3000.Enter the default credentials to log in.
- login:
admin - password:
admin
- login:
Install Node Exporter
After you have configured Grafana, install the Node Exporter binary. It is required for Grafana to measure various machine resources such as, memory, disk, and CPU utilization. The following DaemonSet will be running in the kube-system namespace.
The examples below use the kube-system namespace, you should update this to the correct namespace for your environment. Be sure to install in the same namespace where Prometheus and Grafana are running.
Install node-exporter via DaemonSet by creating a YAML file named
node-exporter.yaml:apiVersion: apps/v1
kind: DaemonSet
metadata:
labels:
app.kubernetes.io/component: exporter
app.kubernetes.io/name: node-exporter
name: node-exporter
namespace: kube-system
spec:
selector:
matchLabels:
app.kubernetes.io/component: exporter
app.kubernetes.io/name: node-exporter
template:
metadata:
labels:
app.kubernetes.io/component: exporter
app.kubernetes.io/name: node-exporter
spec:
containers:
- args:
- --path.sysfs=/host/sys
- --path.rootfs=/host/root
- --no-collector.wifi
- --no-collector.hwmon
- --collector.filesystem.ignored-mount-points=^/(dev|proc|sys|var/lib/docker/.+|var/lib/kubelet/pods/.+)($|/)
- --collector.netclass.ignored-devices=^(veth.*)$
name: node-exporter
image: prom/node-exporter
ports:
- containerPort: 9100
protocol: TCP
resources:
limits:
cpu: 250m
memory: 180Mi
requests:
cpu: 102m
memory: 180Mi
volumeMounts:
- mountPath: /host/sys
mountPropagation: HostToContainer
name: sys
readOnly: true
- mountPath: /host/root
mountPropagation: HostToContainer
name: root
readOnly: true
volumes:
- hostPath:
path: /sys
name: sys
- hostPath:
path: /
name: rootApply the object using the following command:
kubectl apply -f node-exporter.yaml -n kube-systemdaemonset.apps/node-exporter created
Create a service
Kubernetes service will connect a set of pods to an abstracted service name and IP address. The service provides discovery and routing between the pods. The following service will be called node-exportersvc.yaml, and it will use port 9100.
Create the object file and name it
node-exportersvc.yaml:---
kind: Service
apiVersion: v1
metadata:
name: node-exporter
namespace: kube-system
labels:
name: node-exporter
spec:
selector:
app.kubernetes.io/component: exporter
app.kubernetes.io/name: node-exporter
ports:
- name: node-exporter
protocol: TCP
port: 9100
targetPort: 9100Create the service by running the following command:
kubectl apply -f node-exportersvc.yaml -n kube-systemservice/node-exporter created
Create a service monitor
The Service Monitor will scrape the metrics using the following matchLabels and endpoint.
Create the object file and name it
node-exporter-svcmonitor.yaml:apiVersion: monitoring.coreos.com/v1
kind: ServiceMonitor
metadata:
name: node-exporter
labels:
prometheus: portworx
spec:
selector:
matchLabels:
name: node-exporter
endpoints:
- port: node-exporterCreate the
ServiceMonitorobject by running the following command:kubectl apply -f node-exporter-svcmonitor.yaml -n kube-systemservicemonitor.monitoring.coreos.com/node-exporter createdVerify that the
prometheusobject has the followingserviceMonitorSelector:appended:kubectl get prometheus -n kube-system -o yamlserviceMonitorSelector:
matchExpressions:
- key: prometheus
operator: In
values:
- portworx
- px-backup
The serviceMonitorSelector object is automatically appended to the prometheus object that is deployed by the Portworx Operator.
The ServiceMonitor will match any serviceMonitor that has the key prometheus and value of portworx or backup
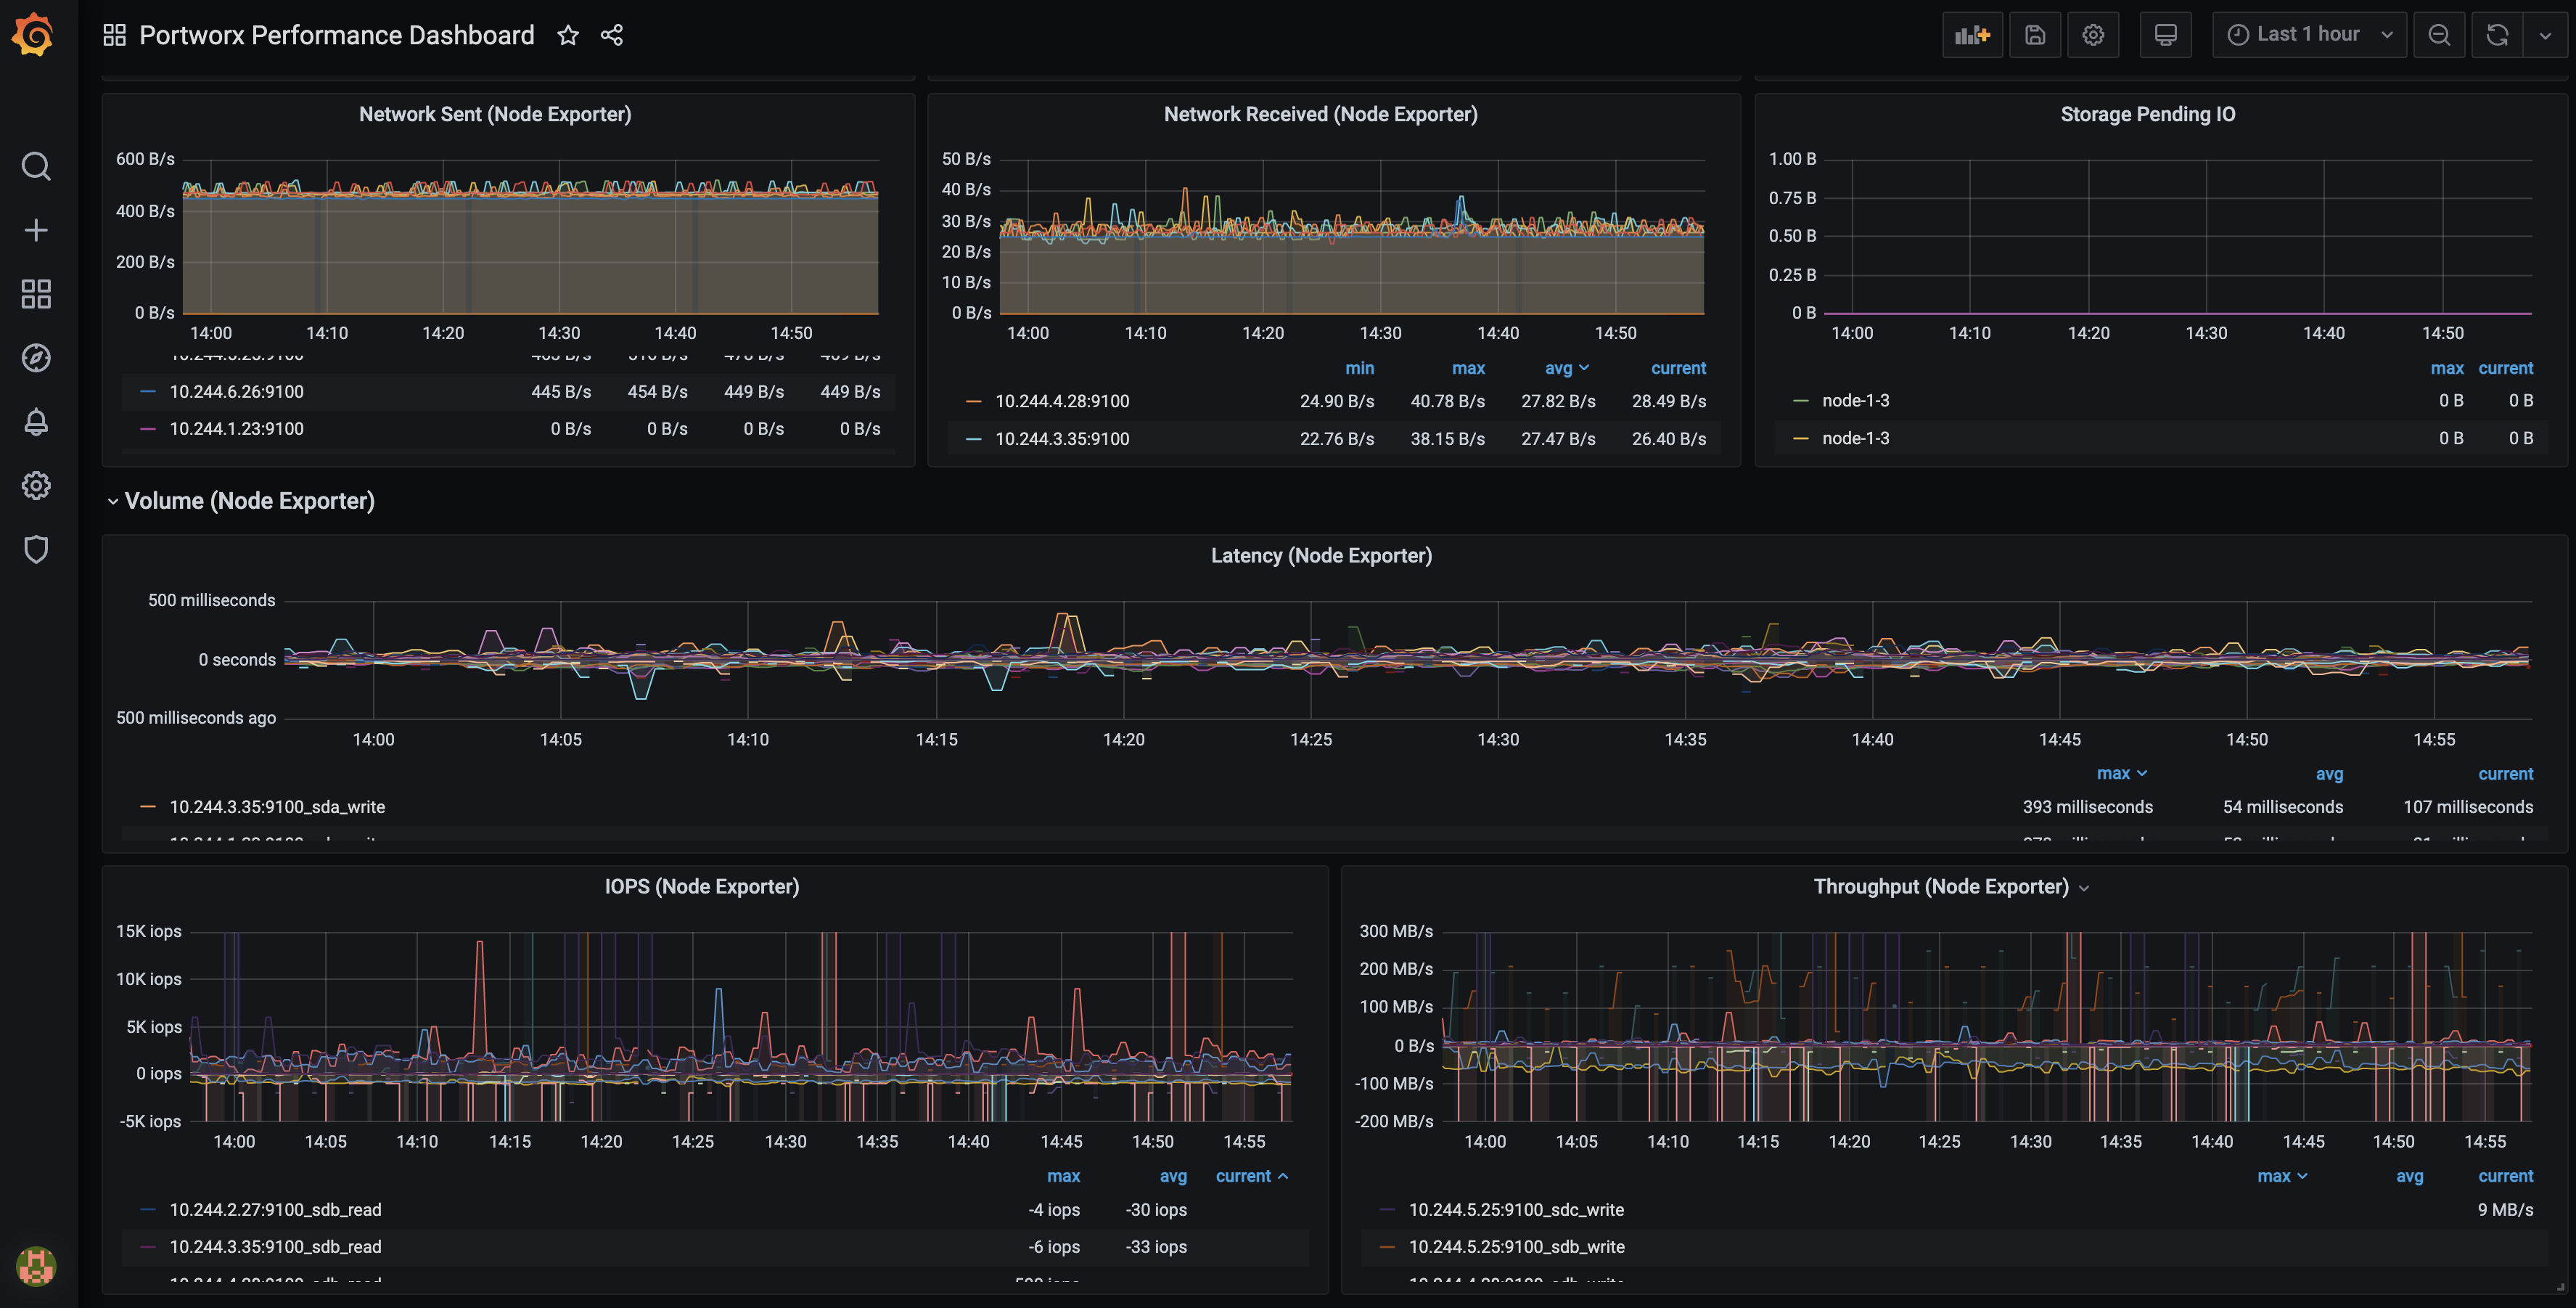
View Node Exporter dashboard in Grafana
Log in to the Grafana UI, from Dashboards navigate to the Manage section, and select Portworx Performance Monitor. You can see the dashboards with (Node Exporter):