Configure manual metrics collection
While PDS includes built-in dashboards for monitoring common usage scenarios for your data services, you may wish to see additional metrics or combine metrics from multiple data services or your cluster. To do this, you can query the full list of metrics from a native Prometheus endpoint using a REST API or add PDS as a Grafana Prometheus data source.
Prerequisites
- PDS account admin privileges
Procedure
To interact with the PDS API, provision a user API key in the Profile page.
Assign the generated API key to an environment variable (for example,
$TOKEN).Retrieve the list of user-accessible accounts by querying the PDS API:
curl -sL -XGET -H "Authorization: Bearer $TOKEN" \
https://prod.pds.portworx.com/api/accounts
Retrieve the ID of the account you wish to use and assign the ID to an environment variable (for example,
$ACCOUND_ID).Use the
ACCOUNT_IDto list the tenants in the account. Retrieve the ID of the tenant you wish to use and assign the ID to an environment variable (for example,$TENANT_ID).curl -sL -XGET -H "Authorization: Bearer $TOKEN" "https://prod.pds.portworx.com/api/accounts/$ACCOUNT_ID/tenants"Generate a service account for this tenant with a user-provided name. Store the resulting service account ID in an environment variable (for example,
$SERVICE_ACCOUNT_ID):curl -sL -XPOST -H "Authorization: Bearer $TOKEN" \
https://prod.pds.portworx.com/api/tenants/$TENANT_ID/service-accounts -d '{"name": "my-service-account"}'Assign the
metrics-readerrole to the service account:curl -sL -XPUT -H "Authorization: Bearer $TOKEN" \
https://prod.pds.portworx.com/api/tenants/$TENANT_ID/role-bindings -d '{"actor_id": "'$SERVICE_ACCOUNT_ID'","actor_type": "service-account","role_name": "metrics-reader"}'Retrieve the token for the previously created service account. Assign the obtained token to an environment variable (for example,
$SERVICE_ACCOUNT_TOKEN):curl -sL -XGET -H "Authorization: Bearer $TOKEN" \
https://prod.pds.portworx.com/api/service-accounts/$SERVICE_ACCOUNT_ID/tokenUse your new service account to query the Prometheus endpoint:
'https://prod.pds.portworx.com/prometheus/api/v1/query?query=<query>'noteEnsure you provide the necessary
AuthorizationandX-Pds-Tenantidheaders.For more information about valid queries that you can use in the above request, see Prometheus’ API documentation.
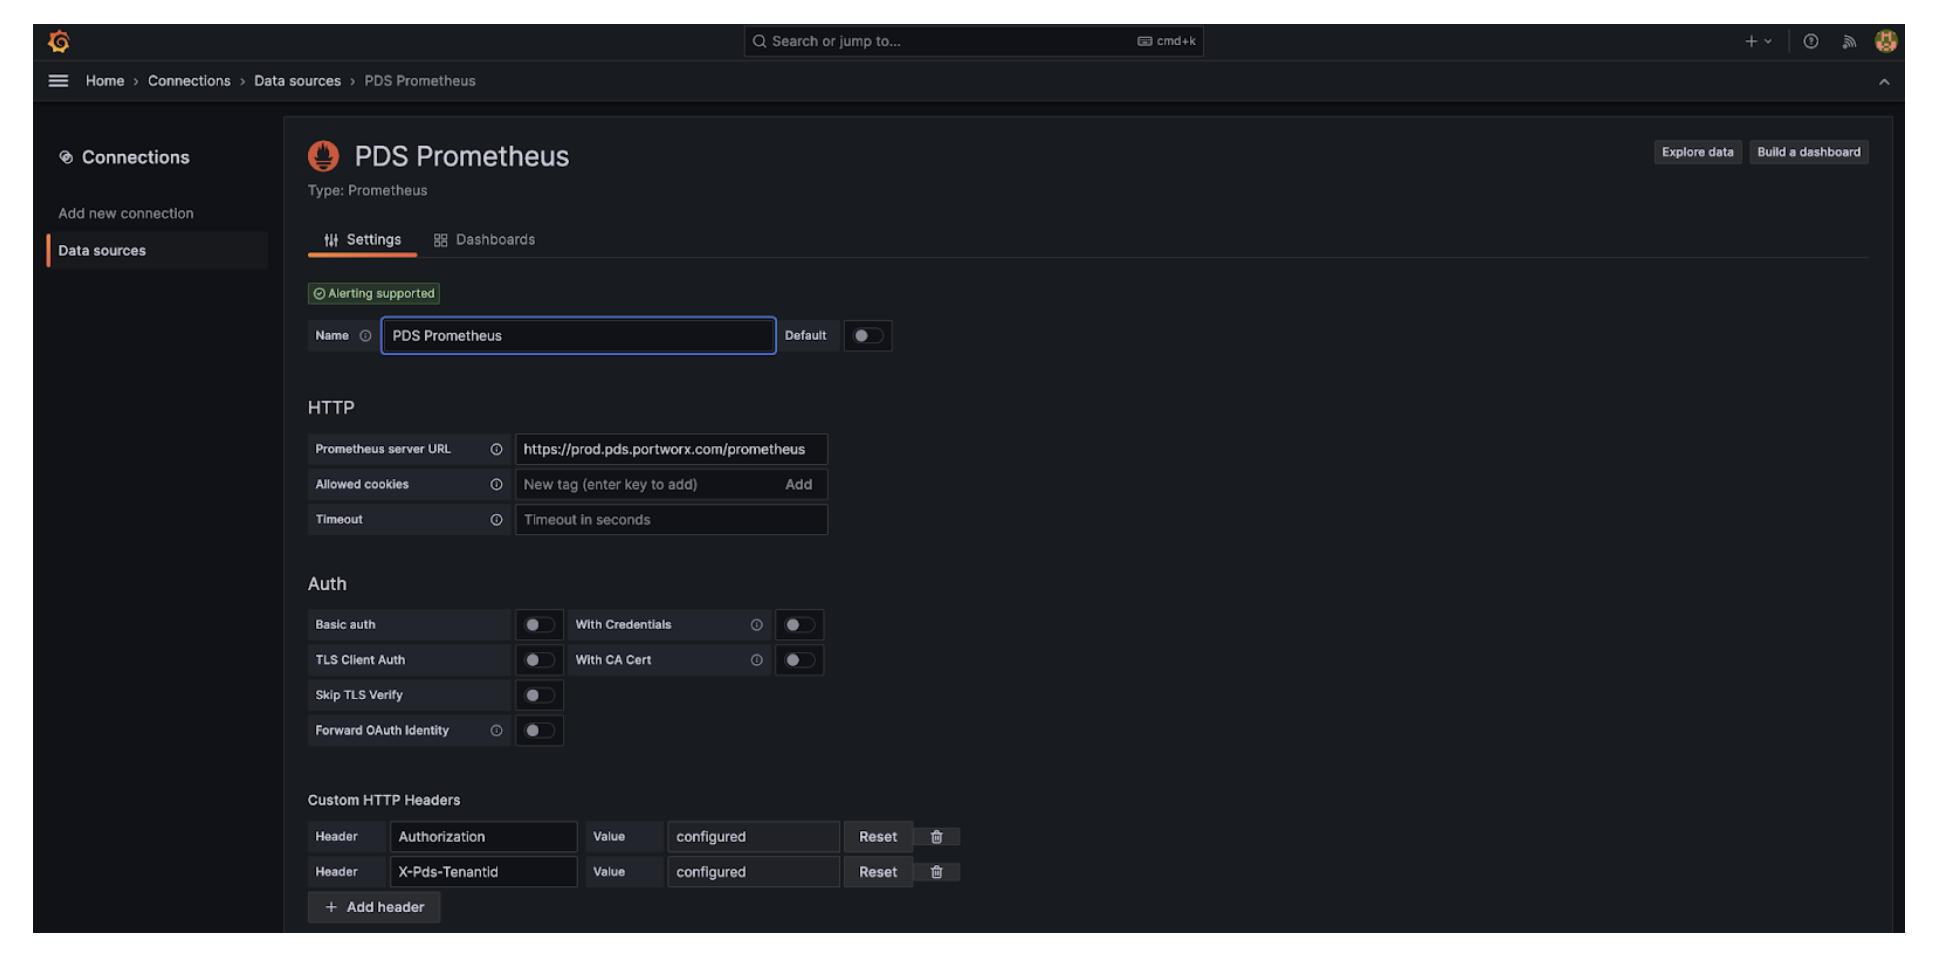
(Optional) Add the PDS endpoint as a Prometheus data source in Grafana, making sure to include the
AuthorizationandX-Pds-Tenantidheaders in the data source settings: