Monitor PX-CSI with Grafana
Grafana provides a graphical interface for visualizing the Prometheus metrics that PX-CSI exports. By connecting Grafana to the PX-CSI Prometheus instance, you can monitor driver health, API latencies, volume usage, and storage connection status using a pre-built dashboard.
Before configuring Grafana, ensure that Prometheus monitoring is enabled and PX-CSI metrics are visible in the Prometheus UI. See Monitor PX-CSI with Prometheus.
Configure Grafana
The following steps deploy Grafana in the portworx namespace and configure it to use the PX-CSI Prometheus instance as a data source.
- Other Kubernetes platforms
- OpenShift Container Platform
-
Create an environment variable for the namespace where Grafana will be deployed:
export NAMESPACE=portworx -
Download the datasource and dashboard provider configuration files:
curl -LO https://docs.portworx.com/portworx-csi/grafana/grafana-datasource.yamlcurl -LO https://docs.portworx.com/portworx-csi/grafana/grafana-dashboard-config.yaml -
Create ConfigMaps for the datasource and dashboard provider:
kubectl -n $NAMESPACE create configmap grafana-source-config --from-file=grafana-datasource.yamlkubectl -n $NAMESPACE create configmap grafana-dashboard-config --from-file=grafana-dashboard-config.yaml -
Download the PX-CSI dashboard JSON and create a ConfigMap for it:
curl -LO https://docs.portworx.com/portworx-csi/grafana/px-csi-dashboard.jsonkubectl -n $NAMESPACE create configmap grafana-dashboards --from-file=px-csi-dashboard.json -
Deploy Grafana:
kubectl -n $NAMESPACE apply -f https://docs.portworx.com/portworx-csi/grafana/grafana.yaml -
Verify the Grafana pod is running:
kubectl -n $NAMESPACE get pods | grep grafanagrafana-7d789d5cf9-bklf2 1/1 Running 0 3m12s -
Forward the Grafana service to access the UI:
kubectl -n $NAMESPACE port-forward service/grafana 3000:3000 -
Open http://localhost:3000 and log in with the default credentials:
- Username:
admin - Password:
admin
- Username:
On OpenShift, PX-CSI exports metrics to the OpenShift built-in Prometheus. You must enable user workload monitoring, retrieve the Thanos Querier URL, and configure Grafana to authenticate with a service account bearer token.
-
Create an environment variable for the namespace where Grafana will be deployed:
export NAMESPACE=portworx -
Enable user workload monitoring by creating a ConfigMap in the
openshift-monitoringnamespace:apiVersion: v1kind: ConfigMapmetadata:name: cluster-monitoring-confignamespace: openshift-monitoringdata:config.yaml: |enableUserWorkload: trueApply the resource:
kubectl apply -f cluster-monitoring-config.yaml -
Download the datasource and dashboard provider configuration files:
curl -LO https://docs.portworx.com/portworx-csi/grafana/grafana-datasource-ocp.yamlcurl -LO https://docs.portworx.com/portworx-csi/grafana/grafana-dashboard-config.yaml -
Retrieve the Thanos Querier URL:
-
If Grafana runs inside the same OpenShift cluster, use the internal service DNS:
https://thanos-querier.openshift-monitoring.svc.cluster.local:9091 -
If Grafana runs outside the cluster, retrieve the external route:
oc get route thanos-querier -n openshift-monitoring -o jsonpath='{.spec.host}'
-
-
Create a service account for Grafana and grant it the
cluster-monitoring-viewrole:oc -n $NAMESPACE create serviceaccount grafanaoc -n $NAMESPACE adm policy add-cluster-role-to-user cluster-monitoring-view -z grafana -
Generate a bearer token for the service account:
oc -n $NAMESPACE create token grafana --duration=8760hSave the output token for the next step.
-
Edit
grafana-datasource-ocp.yaml: replace<THANOS_QUERIER_HOST>with the URL from step 3 and<BEARER_TOKEN>with the token from step 5. -
Create ConfigMaps for the datasource and dashboard provider:
oc -n $NAMESPACE create configmap grafana-source-config --from-file=grafana-datasource-ocp.yamloc -n $NAMESPACE create configmap grafana-dashboard-config --from-file=grafana-dashboard-config.yaml -
Download the PX-CSI dashboard JSON and create a ConfigMap for it:
curl -LO https://docs.portworx.com/portworx-csi/grafana/px-csi-dashboard.jsonoc -n $NAMESPACE create configmap grafana-dashboards --from-file=px-csi-dashboard.json -
Deploy Grafana:
oc -n $NAMESPACE apply -f https://docs.portworx.com/portworx-csi/grafana/grafana.yaml -
Verify the Grafana pod is running:
oc -n $NAMESPACE get pods | grep grafanagrafana-7d789d5cf9-bklf2 1/1 Running 0 3m12s -
Forward the Grafana service to access the UI:
oc -n $NAMESPACE port-forward service/grafana 3000:3000 -
Open http://localhost:3000 and log in with the default credentials:
- Username:
admin - Password:
admin
- Username:
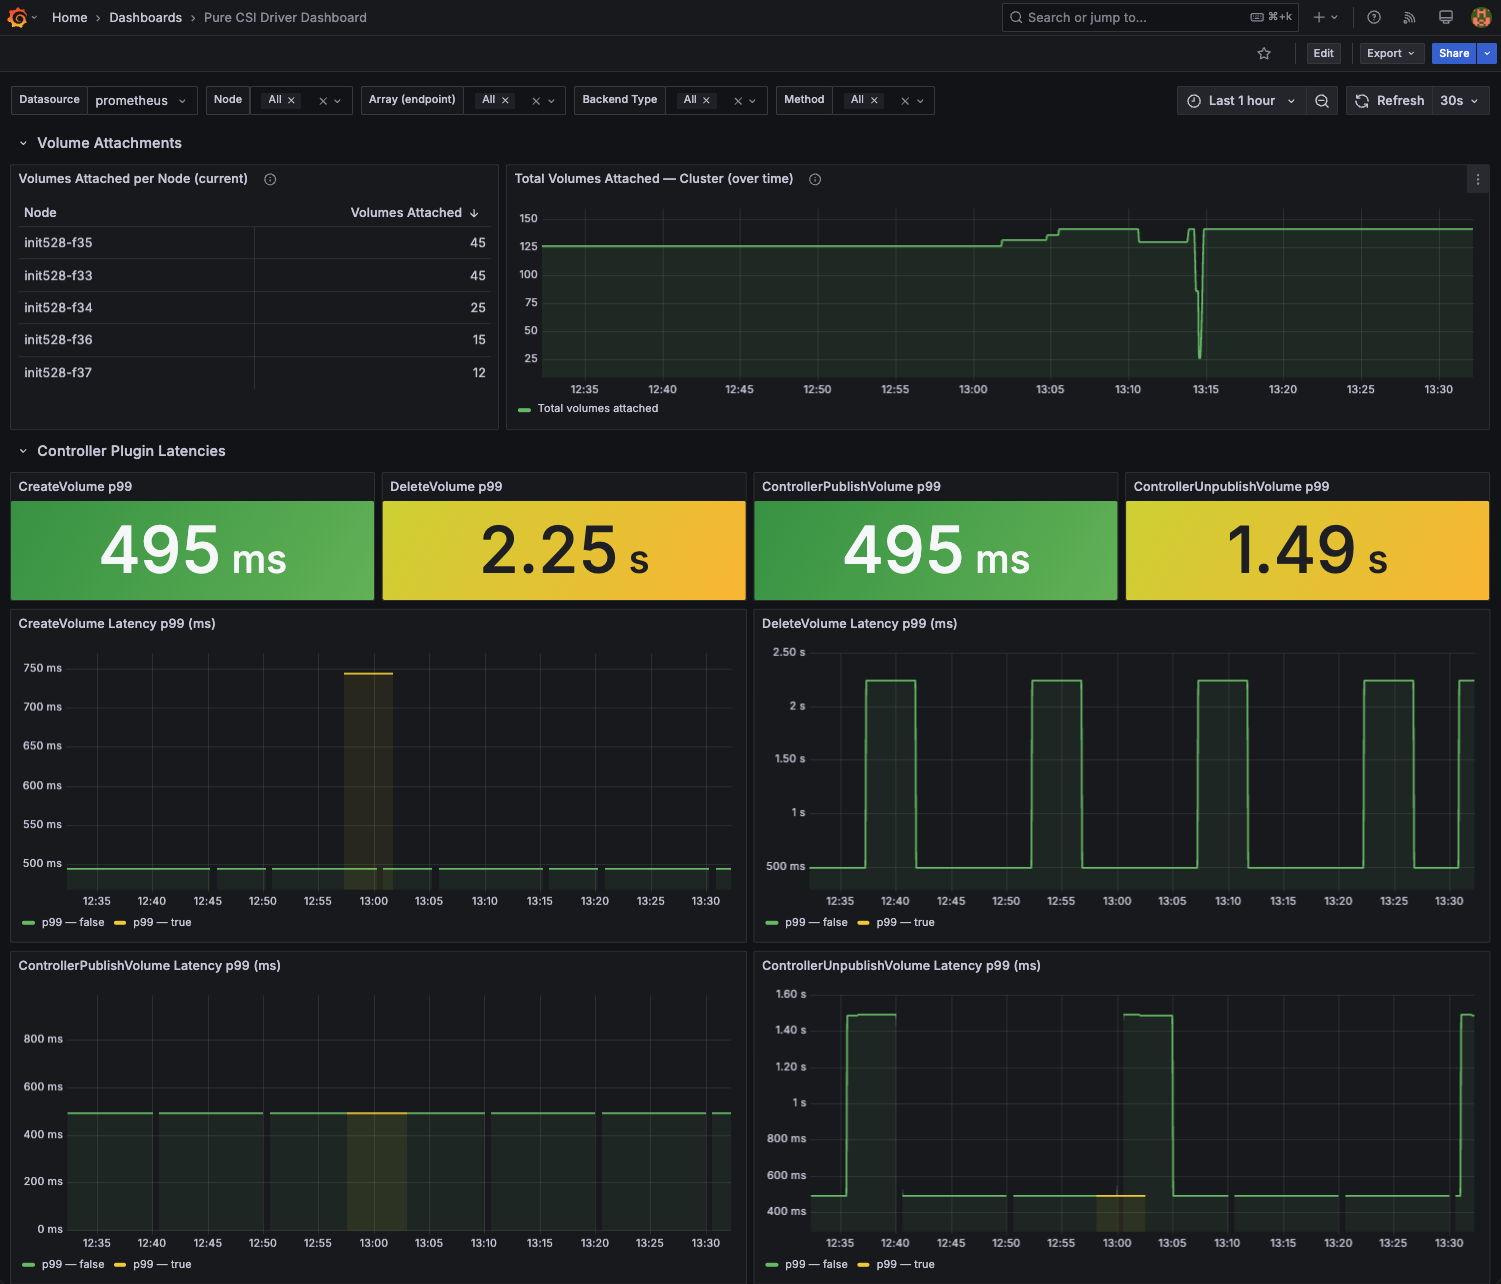
Dashboard overview
The PX-CSI dashboard contains the following rows:
-
Volume Attachments: Current attachment counts per node and total attached volumes across the cluster over time. Use this to spot nodes with an unusually high number of attached volumes.
-
Controller Plugin Latencies: p99 latency stats and time-series for the four controller-side CSI calls:
CreateVolume,DeleteVolume,ControllerPublishVolume, andControllerUnpublishVolume. Use this to detect regressions in volume provisioning and attachment. -
Node Plugin Latencies: p99 latency stats and time-series for the four node-side CSI calls:
NodeStageVolume,NodeUnstageVolume,NodePublishVolume, andNodeUnpublishVolume, broken down per node. Use this to identify slow mount or staging operations on specific nodes. -
FA/FB API Latency by Method: p99 latency tiles and trend charts for GET, POST, and DELETE requests to your FlashArray and FlashBlade backends. Use this to compare read-heavy versus write-heavy API latency.
-
FA/FB API Calls per Array: Total calls, failed calls, success rate, and number of arrays contacted for the selected time range, with a per-array breakdown table. Use this first when investigating backend connectivity or reliability issues.
-
FA/FB API Latency by Array: p99 latency broken down by HTTP method, API path, and array endpoint on a single time-series panel. Use this to isolate which specific path or array is causing a latency spike.
-
FA/FB API Failures by Status Code: Failure rate time-series grouped by HTTP status code, with separate tiles for auth failures (401/403) and network errors. Use this to distinguish authentication issues from connectivity problems.
-
FA Block Endpoint Calls: Call counts for FlashArray block-specific API paths such as
/array-connections,/pods, and/protection-groups. Populated only in environments using FlashArray block volumes. -
FA Files Endpoint Calls: Call counts for FlashArray file-specific API paths such as
/directories,/directory-exports, and/directory-snapshots. Populated only in environments using FlashArray file volumes. -
FA Files and FlashBlade Endpoint Calls: Call counts for API paths shared between FlashArray file volumes and FlashBlade, including
/file-systems,/file-system-exports, and/nfs-export-policies. -
Transport Health: Node detection counts and healthy versus unhealthy session or connection counts per node for each active storage protocol (iSCSI, NVMe, FC). Inactive protocols display "No data."
-
Multipath Device Health: Total, healthy, and unhealthy path counts per multipath device per node, identified by volume ID. Use this to detect path degradation on specific volumes.