Monitor Portworx Clusters on Kubernetes
To ensure your storage infrastructure's health, performance, and reliability, it is crucial to monitor your Portworx cluster. The monitoring approach varies depending on your deployment environment. For most setups, Portworx's integrated Prometheus and Grafana deployment runs by default.
Monitoring your Portworx cluster in a Kubernetes environment involves leveraging technologies like Prometheus, Alertmanager, and Grafana. These tools help in collecting data, managing alerts, and visualizing metrics.
- Prometheus: Collects metrics, which are essential for Autopilot to identify and respond to conditions like storage capacity issues, enabling automatic PVC expansion and storage pool scaling.
- Alertmanager: Manages alerts, integrating with Autopilot for timely notifications about critical cluster conditions.
- Grafana: Visualizes data from Prometheus in an easy-to-understand format, aiding in quick decision-making for cluster management.
Each tool plays a vital role in ensuring efficient, automated monitoring and response within your cluster.
By default, Portworx deploys PX Prometheus for monitoring. Starting with Operator version 25.5.0, you can also use an external Prometheus instance.
Prerequisites
- Configure Prometheus. For more information, see Configure Prometheus.
- Configure Grafana. For more information, see Configure Grafana.
- Configure Alertmanager. For more information, see Configure Alertmanager.
Grafana dashboards for Portworx
Grafana offers several built-in dashboards for monitoring Portworx. These dashboards provide a real-time view of the system’s performance and status, helping you maintain optimal performance and quickly diagnose any issues.
Node Exporter dashboard
Log in to the Grafana UI, from Dashboards navigate to the Manage section, and select Portworx Performance Monitor. You can see the dashboards with (Node Exporter):

Etcd dashboard
The Etcd Dashboard provides metrics specific to the etcd component, which is critical for cluster coordination.

Key panels include:
- Disk Sync Duration: Tracks the latency of persisting etcd log entries to disk. High values (> 1s) may indicate issues with the KVDB disk metrics.
- Up: Monitors the health of KVDB nodes.
Portworx Cluster dashboard
This dashboard provides an overview of the cluster's storage and health.

Key panels include:
- Usage Meter: Displays the percentage of utilized storage compared to total capacity.
- Capacity Used: Shows the actual storage space used in the cluster.
- Nodes (total): Displays the number of nodes in the Portworx cluster.
- Storage Providers: Indicates how many storage nodes are currently online.
- Quorum: Tracks the quorum status of the cluster.
- Nodes online: Number of online nodes in the cluster (includes storage and storage-less).
- Avg. Cluster CPU: Monitors the average CPU usage across all nodes.
Portworx Node dashboard
The Node dashboard focuses on individual nodes within the cluster.

Key panels include:
- PWX Disk Usage: Monitors the Portworx storage space used per node.
- PWX Disk IO: Displays the time spent on disk read and write operations per node.
- PWX Disk Throughput: Shows the rate of total bytes read and written for each node.
- PWX Disk Latency: Provides the average time spent on read and write operations for each node.
Portworx Volume dashboard
The Volume dashboard provides insights into the performance and utilization of storage volumes within the cluster. It is divided into two main sections: All Volumes in the Cluster and Individual Volumes, offering a detailed view of both overall and per-volume metrics.

All Volumes in the Cluster
This section displays metrics aggregated across all volumes in the cluster, helping you track overall performance and identify any potential bottlenecks.
- Avg Read Latency (1m): Average time (in seconds) spent on completing read operations during the last minute for all volumes.
- Avg Write Latency (1m): Average time (in seconds) spent on completing write operations during the last minute for all volumes.
- Top n Volumes by Capacity: Lists the top n volumes in the cluster based on their storage capacity.
- Top n Volumes by IO Depth: Lists the top n volumes based on the number of I/O operations currently in progress.
Individual Volumes
This section provides metrics for each individual volume in the cluster, allowing for detailed monitoring of specific volume performance and usage.
- Replication Level (HA): Displays both the current and configured High Availability (HA) level for the volume.
- Avg Read Latency: Average time (in seconds) spent per successfully completed read operation for the volume.
- Avg Write Latency: Average time (in seconds) spent per successfully completed write operation for the volume.
- Volume Usage: Shows the total capacity and the used storage space for the volume.
- Volume Latency: Displays the average time (in seconds) spent per successfully completed read and write operations during the given interval.
- Volume IOPs: Number of successfully completed I/O operations per second for the volume.
- Volume IO Depth: Number of I/O operations currently in progress for the volume.
- Volume IO Throughput: Displays the number of bytes read and written per second for the volume.
Portworx Performance dashboard
The Performance dashboard provides a comprehensive view of the performance metrics for your Portworx cluster. This dashboard helps you monitor the cluster’s overall health, storage usage, and I/O performance, enabling you to quickly identify any issues affecting performance.

Key panels include:
- Members: Displays the total number of nodes in your Portworx cluster.
- Total Volumes: The total number of volumes in the cluster.
- Storage Providers: Number of storage nodes that are currently online.
- Attached Volumes: Indicates the number of volumes that are attached to the nodes.
- Storage Offline: The count of nodes where the storage is either full or down.
- Avg HA Level: The average High Availability (HA) level of all volumes in the cluster.
- Total Available: Displays the total available storage space in the cluster.
- Total Used: The total size of volumes that have been provisioned. This is calculated based on the utilized disk space across all nodes.
- Volume Total Used: Shows the used storage space of all volumes combined.
- Storage Usage: Displays the utilized storage space for each individual node.
- Storage Pending IO: Number of read and write operations that are currently in progress for each node.
Volume-specific metrics
- Latency (Volume): Displays the average time (in seconds) spent per successfully completed read and write operations for each volume during the specified interval.
- Discarded Bytes: The total number of discarded bytes on the volume. These discards are replicated based on the volume’s replication factor. When an application deletes files, the file system converts these deletions into block discards on the Portworx volume.
- PX Pool Write Latency: The write latency experienced by Portworx when writing I/O operations to the page cache.
- PX Pool Write Throughput: The write throughput observed by Portworx, combining all I/O operations across all replicas provisioned on the pool. These represent the application-level I/Os performed on the pool.
- PX Pool Flush Latency: The time taken for Portworx to complete periodic flush/sync operations, which ensure the stability of data and associated metadata in the page cache.
- PX Pool Flush Throughput: The amount of data synced during each flush/sync operation, averaged over the time period.
- Volume IO Throughput: The amount of data being synced by the periodic flush/sync operation, averaged over the interval.
Portworx DR dashboard
The Portworx DR dashboard provides a high-level view of disaster recovery activity orchestrated by Stork, including migrations, failovers, and failbacks between clusters.
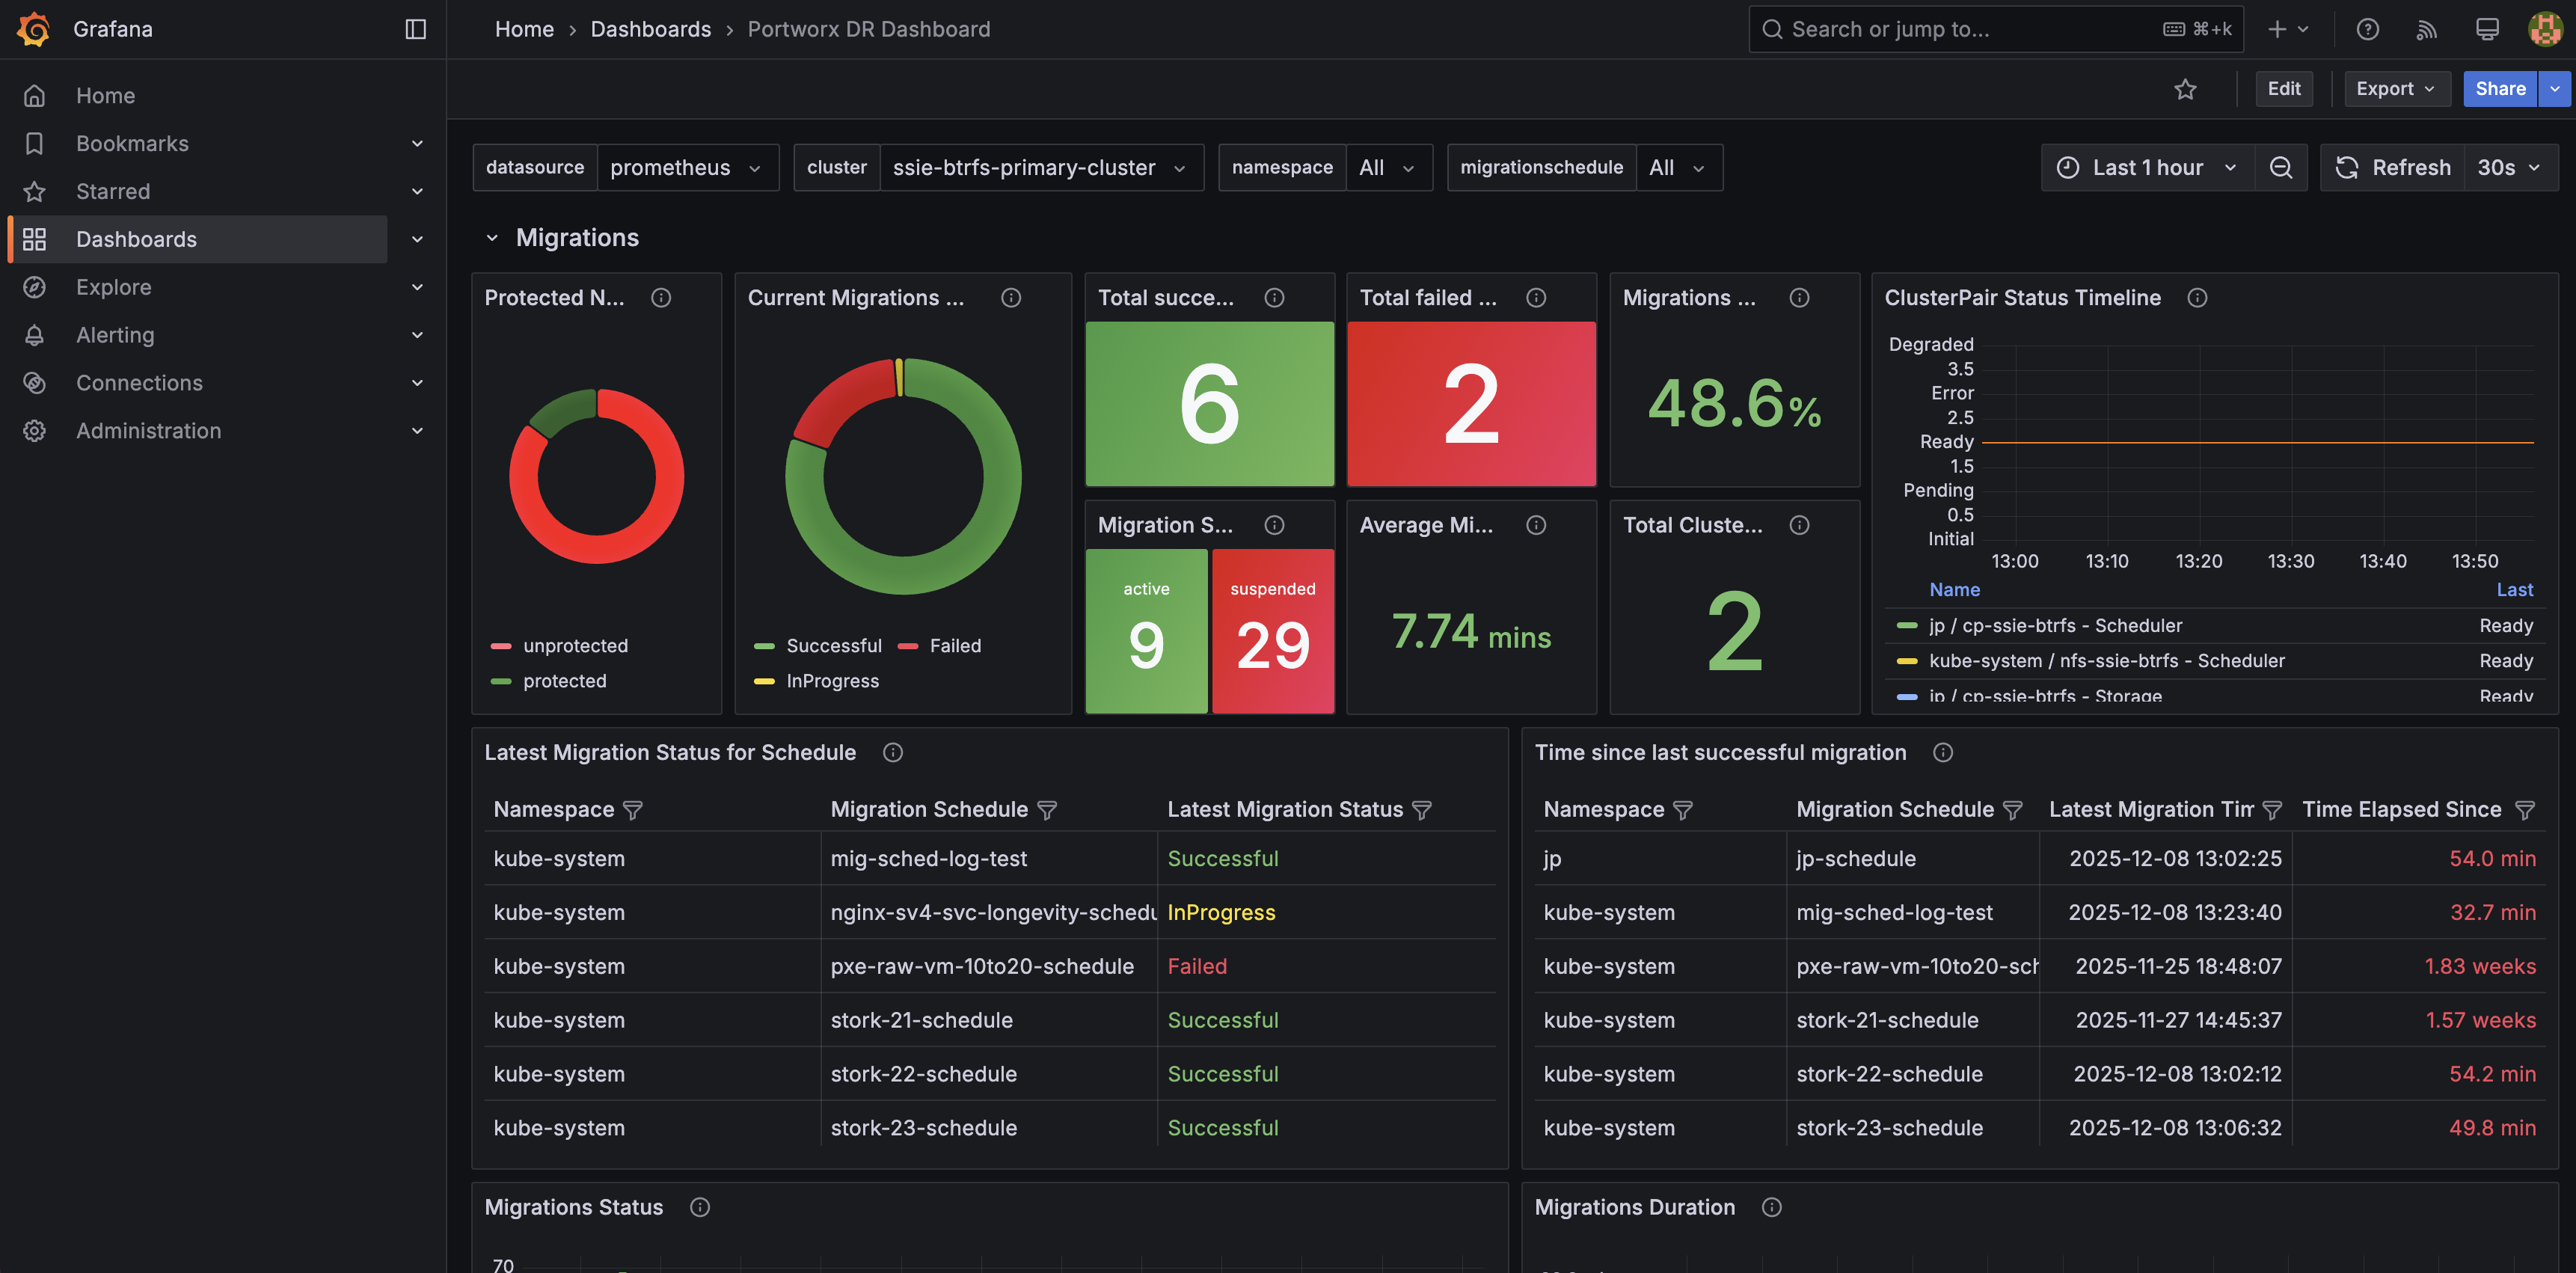
Key panels include:
- DR overview: Summarizes the current state of disaster recovery, including recent DR activity and overall health of your DR configuration.
- Migrations: Shows the status and progress of namespace migrations between source and destination clusters so you can quickly spot failures or long‑running operations.
- Failover and failback actions: Highlights recent DR operations across namespaces, helping you verify that planned or automated actions completed successfully.
- Protected namespaces and cluster pairs: Displays which namespaces are protected for DR and the state of cluster pairs between sites.
This dashboard is powered by the Portworx DR and Stork metrics. For details on the underlying metrics, see the Portworx DR and Stork metrics section.
Custom metrics and additional monitoring
Portworx also offers a wide range of custom metrics for monitoring specific aspects of your environment. For more information on available metrics, you can refer to the Portworx Metrics documentation.
Using Grafana to monitor Portworx clusters provides visibility into the health, performance, and usage of your storage environment. With built-in dashboards and customizable metrics, you can quickly identify issues and ensure your infrastructure runs smoothly.
Monitoring via pxctl
Portworx ships with the pxctl CLI out of the box that users can use to perform management operations.
Where do I run pxctl?
You can run pxctl by accessing any worker node in your cluster with ssh or by running the kubectl exec command on any Portworx pod.
Listing Portworx storage pools
Refer to Storage Pools concept.
The following pxctl command lists all the Portworx storage pools in your cluster:
pxctl cluster provision-status
NODE                                    NODE STATUS     POOL                                            POOL STATUS     IO_PRIORITY     SIZE    AVAILABLE       USED    PROVISIONED     ZONE    REGION  RACK
xxxxxxxx-xxxx-xxxx-xxxx-299df278b7d5    Up              0 ( xxxxxxxx-xxxx-xxxx-xxxx-55b59ddd8f2b )      Online          HIGH            100 GiB 86 GiB          14 GiB  28 GiB          AZ1     default default
xxxxxxxx-xxxx-xxxx-xxxx-6e8e9a0e00fb    Up              0 ( xxxxxxxx-xxxx-xxxx-xxxx-00393d023fe1 )      Online          HIGH            100 GiB 93 GiB          7.0 GiB 1.0 GiB         AZ1     default default
xxxxxxxx-xxxx-xxxx-xxxx-135ef03cfa34    Up              0 ( xxxxxxxx-xxxx-xxxx-xxxx-596c0ceab709 )      Online          HIGH            100 GiB 93 GiB          7.0 GiB 0 B             AZ1     default default
xxxxxxxx-xxxx-xxxx-xxxx-fa69c643d7bf    Up              0 ( xxxxxxxx-xxxx-xxxx-xxxx-1c560f914963 )      Online          HIGH            100 GiB 93 GiB          7.0 GiB 0 B             AZ1     default default
Monitoring Using Portworx Central
Portworx Central simplifies management, monitoring, and metadata services for one or more Portworx clusters on Kubernetes. Using this single pane of glass, enterprises can easily manage the state of their hybrid- and multi-cloud Kubernetes applications with embedded monitoring and metrics directly in the Portworx user interface.
A Portworx cluster needs to be updated to Portworx Enterprise 2.9 before using Portworx Central.
For more information about installing Portworx Central and its components, refer to the Portworx Central documentation.
Listing Portworx disks (VMDKs)
Where are Portworx VMDKs located?
Portworx creates disks in a folder called osd-provisioned-disks in the ESXi datastore. The names of the VMDK created by Portworx will have a prefix PX-DO-NOT-DELETE-.
The Cloud Drives (ASG) using pxctl CLI command is useful for getting more insight into the disks provisioned by Portworx in a vSphere environment. The following command provides details on all VMware disks (VMDKs) created by Portworx in your cluster:
pxctl clouddrive list
Cloud Drives Summary
        Number of nodes in the cluster:  4
        Number of drive sets in use:  4
        List of storage nodes:  [xxxxxxxx-xxxx-xxxx-xxxx-299df278b7d5 xxxxxxxx-xxxx-xxxx-xxxx-6e8e9a0e00fb xxxxxxxx-xxxx-xxxx-xxxx-135ef03cfa34 xxxxxxxx-xxxx-xxxx-xxxx-fa69c643d7bf]
        List of storage less nodes:  []

Drive Set List
        NodeIndex       NodeID                                  InstanceID                              Zone    State   Drive IDs
        2               xxxxxxxx-xxxx-xxxx-xxxx-135ef03cfa34    xxxxxxxx-xxxx-xxxx-xxxx-c7a9708ae56d    AZ1     In Use  [datastore-589] xxxxxxxx-xxxx-xxxx-xxxx-ac1f6b204d08/PX-DO-NOT-DELETE-xxxxxxxx-xxxx-xxxx-xxxx-2dee113fa334.vmdk(metadata), [datastore-589] xxxxxxxx-xxxx-xxxx-xxxx-ac1f6b204d08/PX-DO-NOT-DELETE-xxxxxxxx-xxxx-xxxx-xxxx-102ec24e44ab.vmdk(data)
        3               xxxxxxxx-xxxx-xxxx-xxxx-fa69c643d7bf    xxxxxxxx-xxxx-xxxx-xxxx-58a3ea11ce8e    AZ1     In Use  [datastore-589] xxxxxxxx-xxxx-xxxx-xxxx-ac1f6b204d08/PX-DO-NOT-DELETE-xxxxxxxx-xxxx-xxxx-xxxx-2f0dd2e5a3a4.vmdk(metadata), [datastore-589] xxxxxxxx-xxxx-xxxx-xxxx-ac1f6b204d08/PX-DO-NOT-DELETE-xxxxxxxx-xxxx-xxxx-xxxx-abcb04ce8ffa.vmdk(data)
        0               xxxxxxxx-xxxx-xxxx-xxxx-299df278b7d5    xxxxxxxx-xxxx-xxxx-xxxx-85910785c40f    AZ1     In Use  [datastore-589] xxxxxxxx-xxxx-xxxx-xxxx-ac1f6b204d08/PX-DO-NOT-DELETE-xxxxxxxx-xxxx-xxxx-xxxx-a7b1aa11dad1.vmdk(data), [datastore-589] xxxxxxxx-xxxx-xxxx-xxxx-ac1f6b204d08/PX-DO-NOT-DELETE-xxxxxxxx-xxxx-xxxx-xxxx-3903b92659de.vmdk(metadata)
        1               xxxxxxxx-xxxx-xxxx-xxxx-6e8e9a0e00fb    xxxxxxxx-xxxx-xxxx-xxxx-d40a2a02b391    AZ1     In Use  [datastore-589] xxxxxxxx-xxxx-xxxx-xxxx-ac1f6b204d08/PX-DO-NOT-DELETE-xxxxxxxx-xxxx-xxxx-xxxx-24ddc46fef0a.vmdk(metadata), [datastore-589] xxxxxxxx-xxxx-xxxx-xxxx-ac1f6b204d08/PX-DO-NOT-DELETE-xxxxxxxx-xxxx-xxxx-xxxx-762c6de09f19.vmdk(data)