Concepts
Overview
Elasticsearch is an open-source, distributed search and analytics engine. With PDS, you can leverage core capabilities of Kubernetes to deploy and manage your Elasticsearch clusters using a cloud-native, container-based model.
PDS follows the release lifecycle of the upstream Elasticsearch project, meaning new releases are available on PDS shortly after they have become GA. Likewise, older versions of Elasticsearch are removed once they have reached end-of-life. See the list of currently supported Elasticsearch versions.
Like all data services in PDS, Elasticsearch deployments run within Kubernetes. PDS includes a component called the PDS Deployments Operator that manages the deployment of all PDS data services, including Elasticsearch. The operator extends the functionality of Kubernetes by implementing a custom resource called elasticsearch. This resource type represents a Elasticsearch cluster allowing standard Kubernetes tools to be used to manage Elasticsearch clusters, including scaling, monitoring, and, upgrading.
You can learn more about the PDS architecture here.
Clustering
Elasticsearch is a distributed system meant to be run as a cluster of individual nodes. This allows Elasticsearch to be deployed in a fault-tolerant, highly available manner.
Although PDS allows Elasticsearch to be deployed with any number of nodes, high availability can only be achieved when running with three or more nodes. Smaller clusters should only be considered in development environments. In clusters with three or fewer nodes, all nodes are configured with all node roles (master, data, ingest, transform, ml, and remote_cluster_client). In clusters with more than three nodes, only three of the nodes will be configured to include the master role.
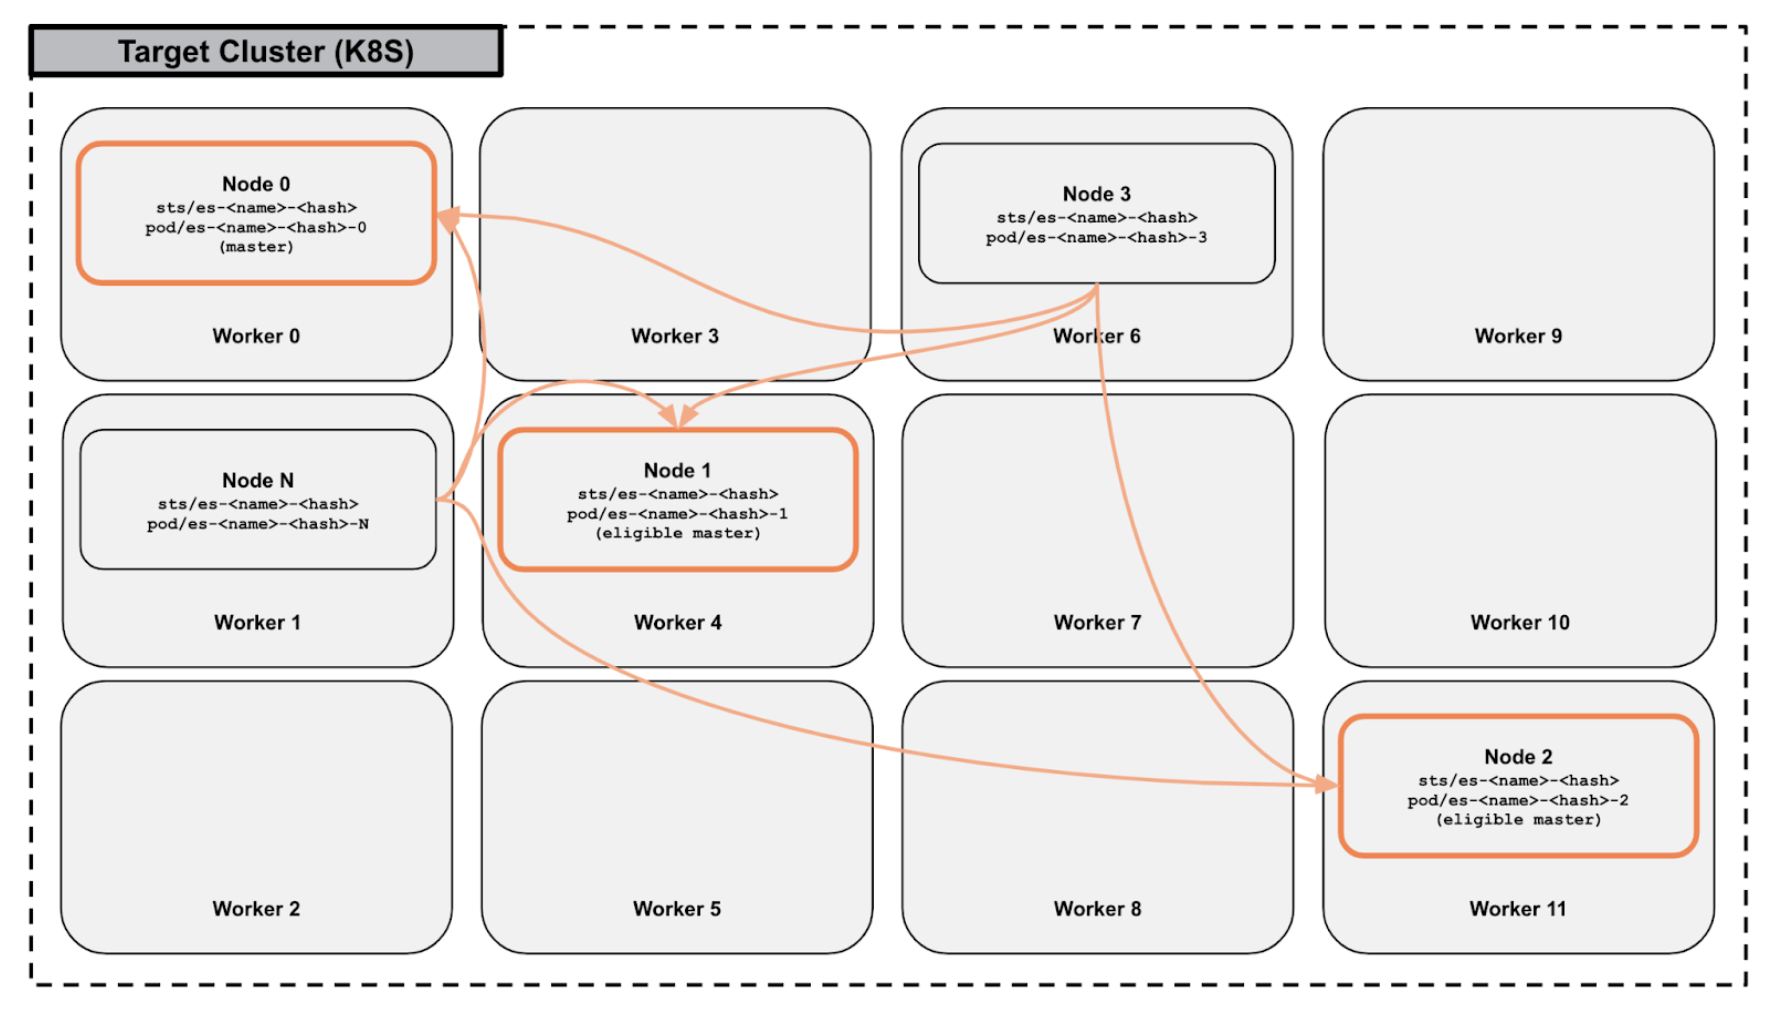
When deployed as a multi-node cluster, individual nodes, deployed as pods within a statefulSet, automatically discover each other to form a cluster. Node discovery within an Elasticsearch cluster is also automatic when pods are deleted and recreated or when additional nodes are added to the cluster via horizontal scaling.
PDS leverages the partition tolerance of Elasticsearch by spreading Elasticsearch servers across Kubernetes worker nodes when possible. PDS utilizes Stork, in combination with Kubernetes storageClasses, to intelligently schedule pods. By provisioning storage from different worker nodes, and then scheduling pods to be hyper-converged with the volumes, PDS deploys Elasticsearch clusters in a way that maximizes fault tolerance, even if entire worker nodes or availability zones are impacted.
Refer to the PDS architecture to learn more about Stork and scheduling.
Replication
Application Replication
Elasticsearch can natively distribute data over nodes in a cluster through a process known as sharding.
Both the number of shards and the number of replica shards can be configured on a per-index basis. Commonly, users configure at least one or more replicas to ensure that shards are replicated across multiple nodes in the cluster.
Application replication is used in Elasticsearch to accomplish load balancing and high availability. With data replicated to multiple nodes, more nodes are able to respond to requests for data. Likewise, in the event of node failure, the cluster may still be available to serve client requests.
Storage Replication
PDS takes data replication further. Storage in PDS is provided by Portworx Enterprise, which itself allows data to be replicated at the storage level.
Each Elasticsearch server in PDS is configured to store data to a persistentVolume which is provisioned by Portworx Enterprise. These Portworx volumes can, in turn, be configured to replicate data to multiple volume replicas. It is recommended to use two volume replicas in PDS in combination with application replication in Elasticsearch.
While the additional level of replication will result in write amplification, the storage-level replication solves a different problem than what is accomplished by application-level replication. Specifically, storage-level replication reduces the amount of downtime in failure scenarios. That is, it reduces RTO.
Portworx volume replicas are able to ensure that data is replicated to different Kubernetes worker nodes or even different availability zones. This maximizes the ability of the Kubernetes API scheduler to schedule Elasticsearch pods.
For example, in cases where Kubernetes worker nodes are unschedulable, pods can be scheduled on other worker nodes where data already exist. Moreover, pods can start instantly and service traffic immediately without waiting for Elasticsearch to replicate data to the pod.
Reference Architecture
For illustrative purposes, consider the following availability zone-aware Elasticsearch and Portworx storage topology:
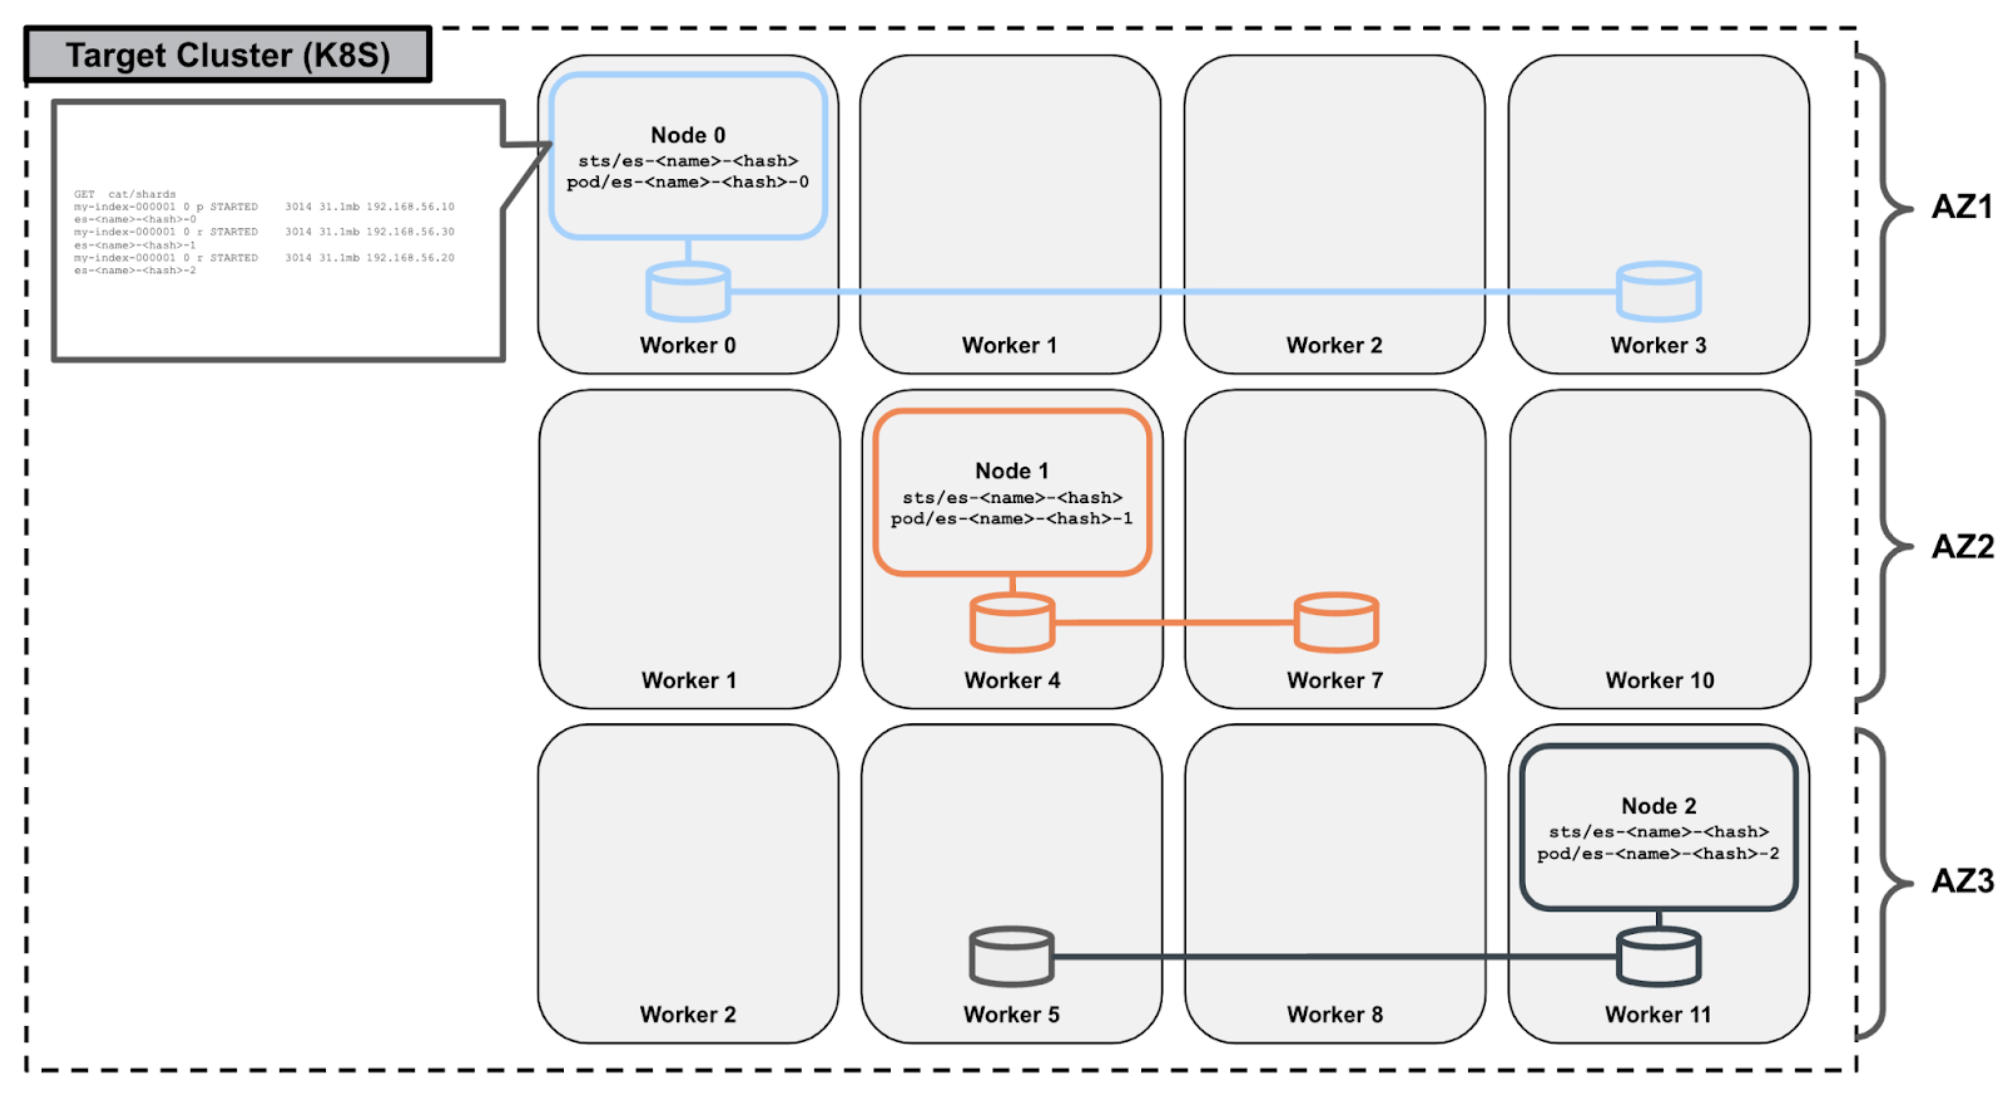
A host and/or storage failure results in the immediate rescheduling of the Elasticsearch server to a different worker node within the same availability zone. Stork can intelligently select the new worker node during the rescheduling process such that it is a worker node that contains a replica of the underlying Portworx volume of Elasticsearch server, maintaining full topic replication while ensuring hyperconvergence for optimal performance:
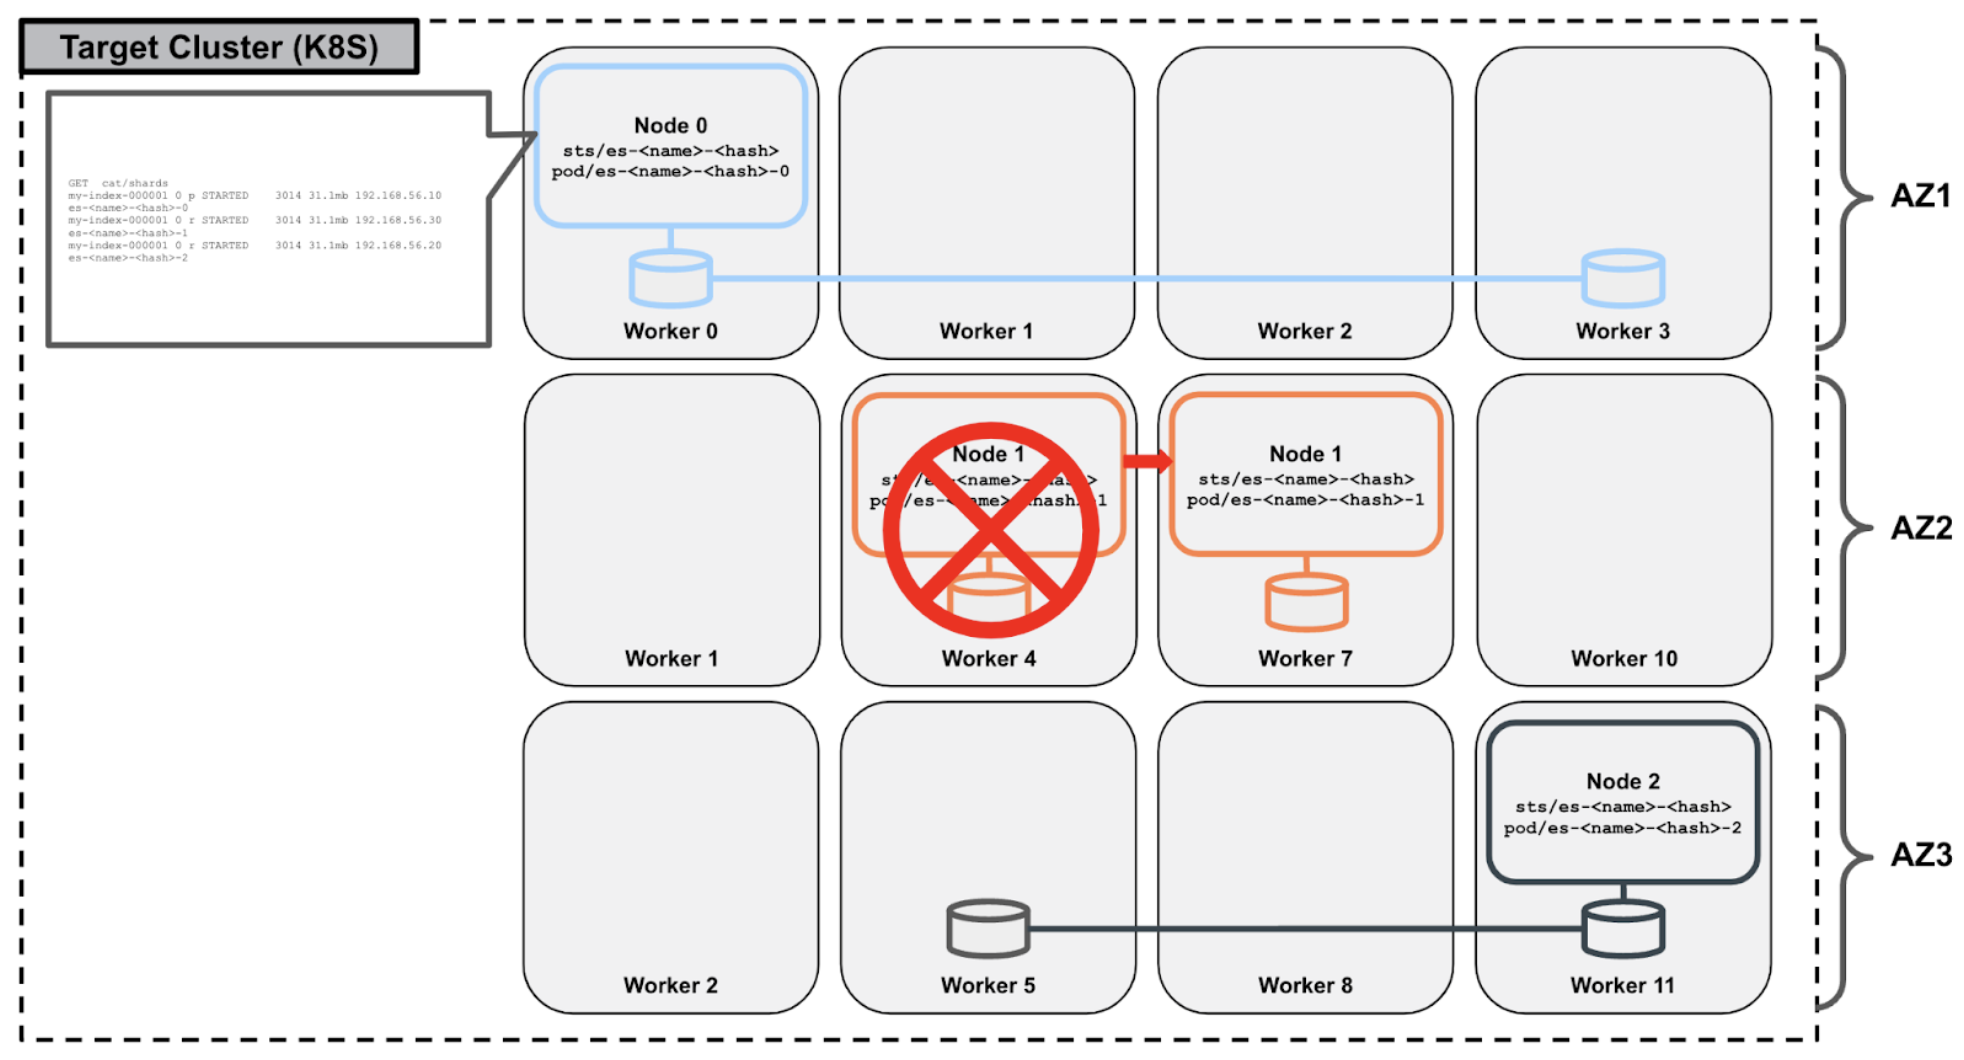
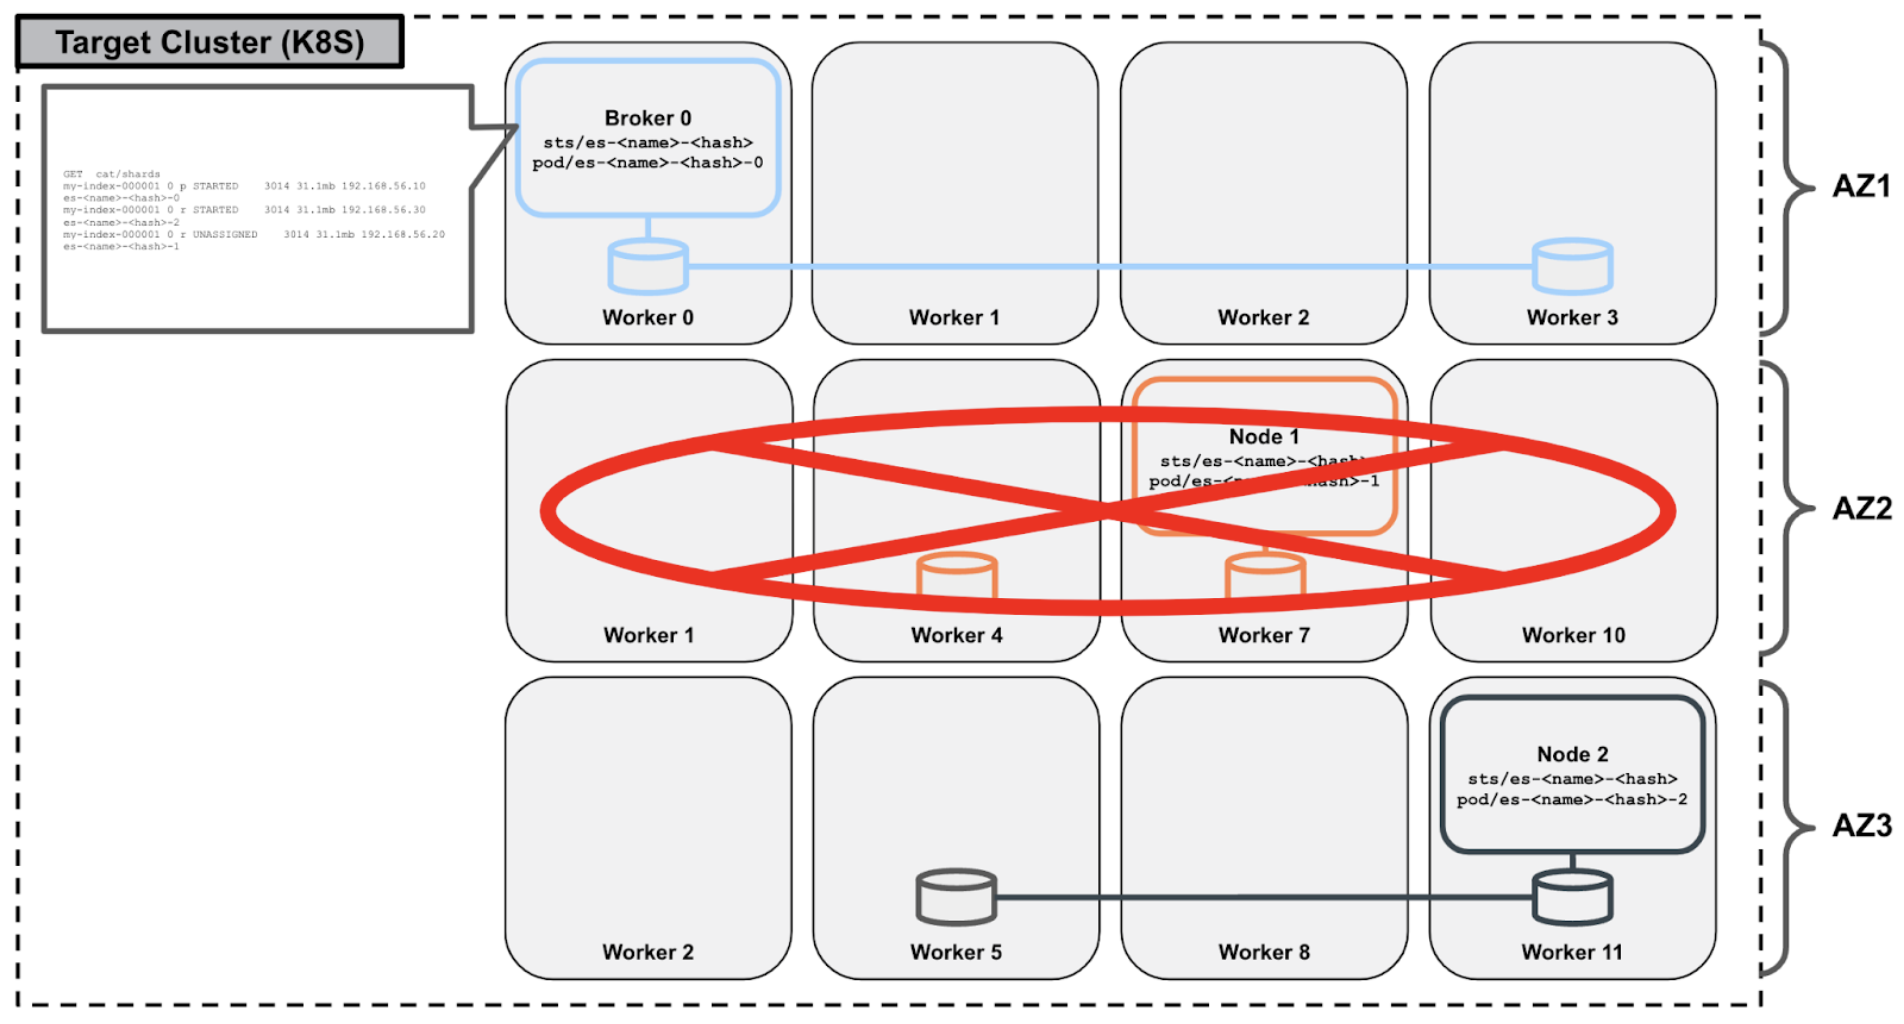
Additionally, in the event that an entire availability zone is unavailable, the native shard replication capability of Elasticsearch ensures that client applications are not impacted.
Configuration
Elasticsearch server configurations can be tuned by specifying setting-specific environment variables within the deployment’s application configuration template.
You can learn more about application configuration templates here. The list of all Elasticsearch server configurations that may be overridden is itemized in the Elasticsearch service’s reference documentation here.
Scaling
Because of the ease with which databases can be deployed and managed in PDS, it is common for you to deploy many of them. Likewise, because it is easy to scale databases in PDS, it is common for you to start with smaller clusters and then add resources when needed. PDS supports both vertical scaling (CPU/memory), as well as horizontal scaling (nodes) of Elasticsearch clusters.
Vertical Scaling
Vertical scaling refers to the process of adding hardware resources to (scaling up) or removing hardware resources from (scaling down) database nodes. In the context of Kubernetes and PDS, these hardware resources are virtualized CPU and memory.
PDS allows Elasticsearch servers to be dynamically reprovisioned with additional or reduced CPU and/or memory. These changes are applied in a rolling fashion across each of the nodes in the Elasticsearch cluster. For multi-node Elasticsearch clusters with replicated indices, this operation is non-disruptive to client applications.
Horizontal Scaling
Horizontal scaling refers to the process of adding database nodes to (scaling out) or removing database nodes from (scaling in) a cluster. Currently, PDS supports only scaling out of clusters. This is accomplished by adding additional pods to the existing Elasticsearch cluster by updating the replica count of the statefulSet.
By default, the addition of nodes is accompanied with the automatic rebalancing of existing shards. Users can adjust or disable this behavior by specifying shard rebalance settings in the deployments application configuration.
Connectivity
PDS manages pod-specific services whose type is determined based on user input (currently, only LoadBalancer and ClusterIP types are supported). This ensures a stable IP address beyond the lifecycle of the pod. For each of these services, an accompanying DNS record will be managed automatically by PDS. Connection information provided through the PDS UI will reflect this by providing users with an array of Elasticsearch server endpoints. Specifying some or all individual server endpoints in client configurations will distribute client requests and mitigate connectivity issues in the event of any individual server being unavailable.
PDS will create a default administrator user called pds, which can be used to connect to the database initially. You can use this user to create additional users and can be dropped if needed. Instance-specific authentication information, including the password of pds user, can be retrieved from the PDS UI within the instance’s connection details page.
Endpoints
| Service Name | Details |
|---|---|
es-<name>-<namespace>-<pod-id>-vip | Endpoint for each pod |
es-<name>-<namespace>-rr | Round Robin Endpoint to all pods |
Backup and Restore
Backup and restore functionality for Elasticsearch in PDS is enabled by Elasticsearch’s snapshot and restore APIs. Backups can be taken ad hoc or can be performed on a schedule. Both full and differential backups are supported.
To learn more about ad hoc and scheduled backups in PDS, refer to the PDS backup docs.
Backups
During the initial deployment of an Elasticsearch cluster, a shared file system repository is created. A dedicated, shared Portworx volume is created specifically to back this repository.
User-initiated ad-hoc backups and scheduled backups result in a snapshot request to Elasticsearch. Once a snapshot has completed successfully, the PDS Backup Operator makes a copy of the volume to a remote object store. This feature, which is provided by Portworx Enterprise’s cloud snapshot functionality, allows PDS to fulfill the 3-2-1 backup strategy (meaning, three copies of data on two types of storage media with one copy offsite).
Restore
Restoring Elasticsearch in PDS is done out-of-place. That is to say, PDS will deploy a new Elasticsearch cluster and restore the data to the new cluster. This prevents you from accidentally overwriting data and allows users to stand up multiple copies of your databases for debugging or forensic purposes.
PDS does not currently support restoration of specific indices.
As with restoring any database, loss of data is likely to occur. Because user passwords are stored within the database, restoring from backup will revert any password changes. Therefore, in order to ensure access to the database, users must manage their own credentials.
Monitoring
With each Elasticsearch server, PDS bundles a Prometheus exporter for monitoring purposes. This exporter is provided by the Prometheus community and makes Elasticsearch metrics available in the Prometheus text-based format. For a full list of metrics, see the reference documentation for Elasticsearch.
The metrics captured by PDS are available for export from the PDS Control Plane. A Prometheus endpoint is available for use with standard tools such as Grafana. For more information about monitoring and data visualization of metrics, see the PDS metrics documentation.