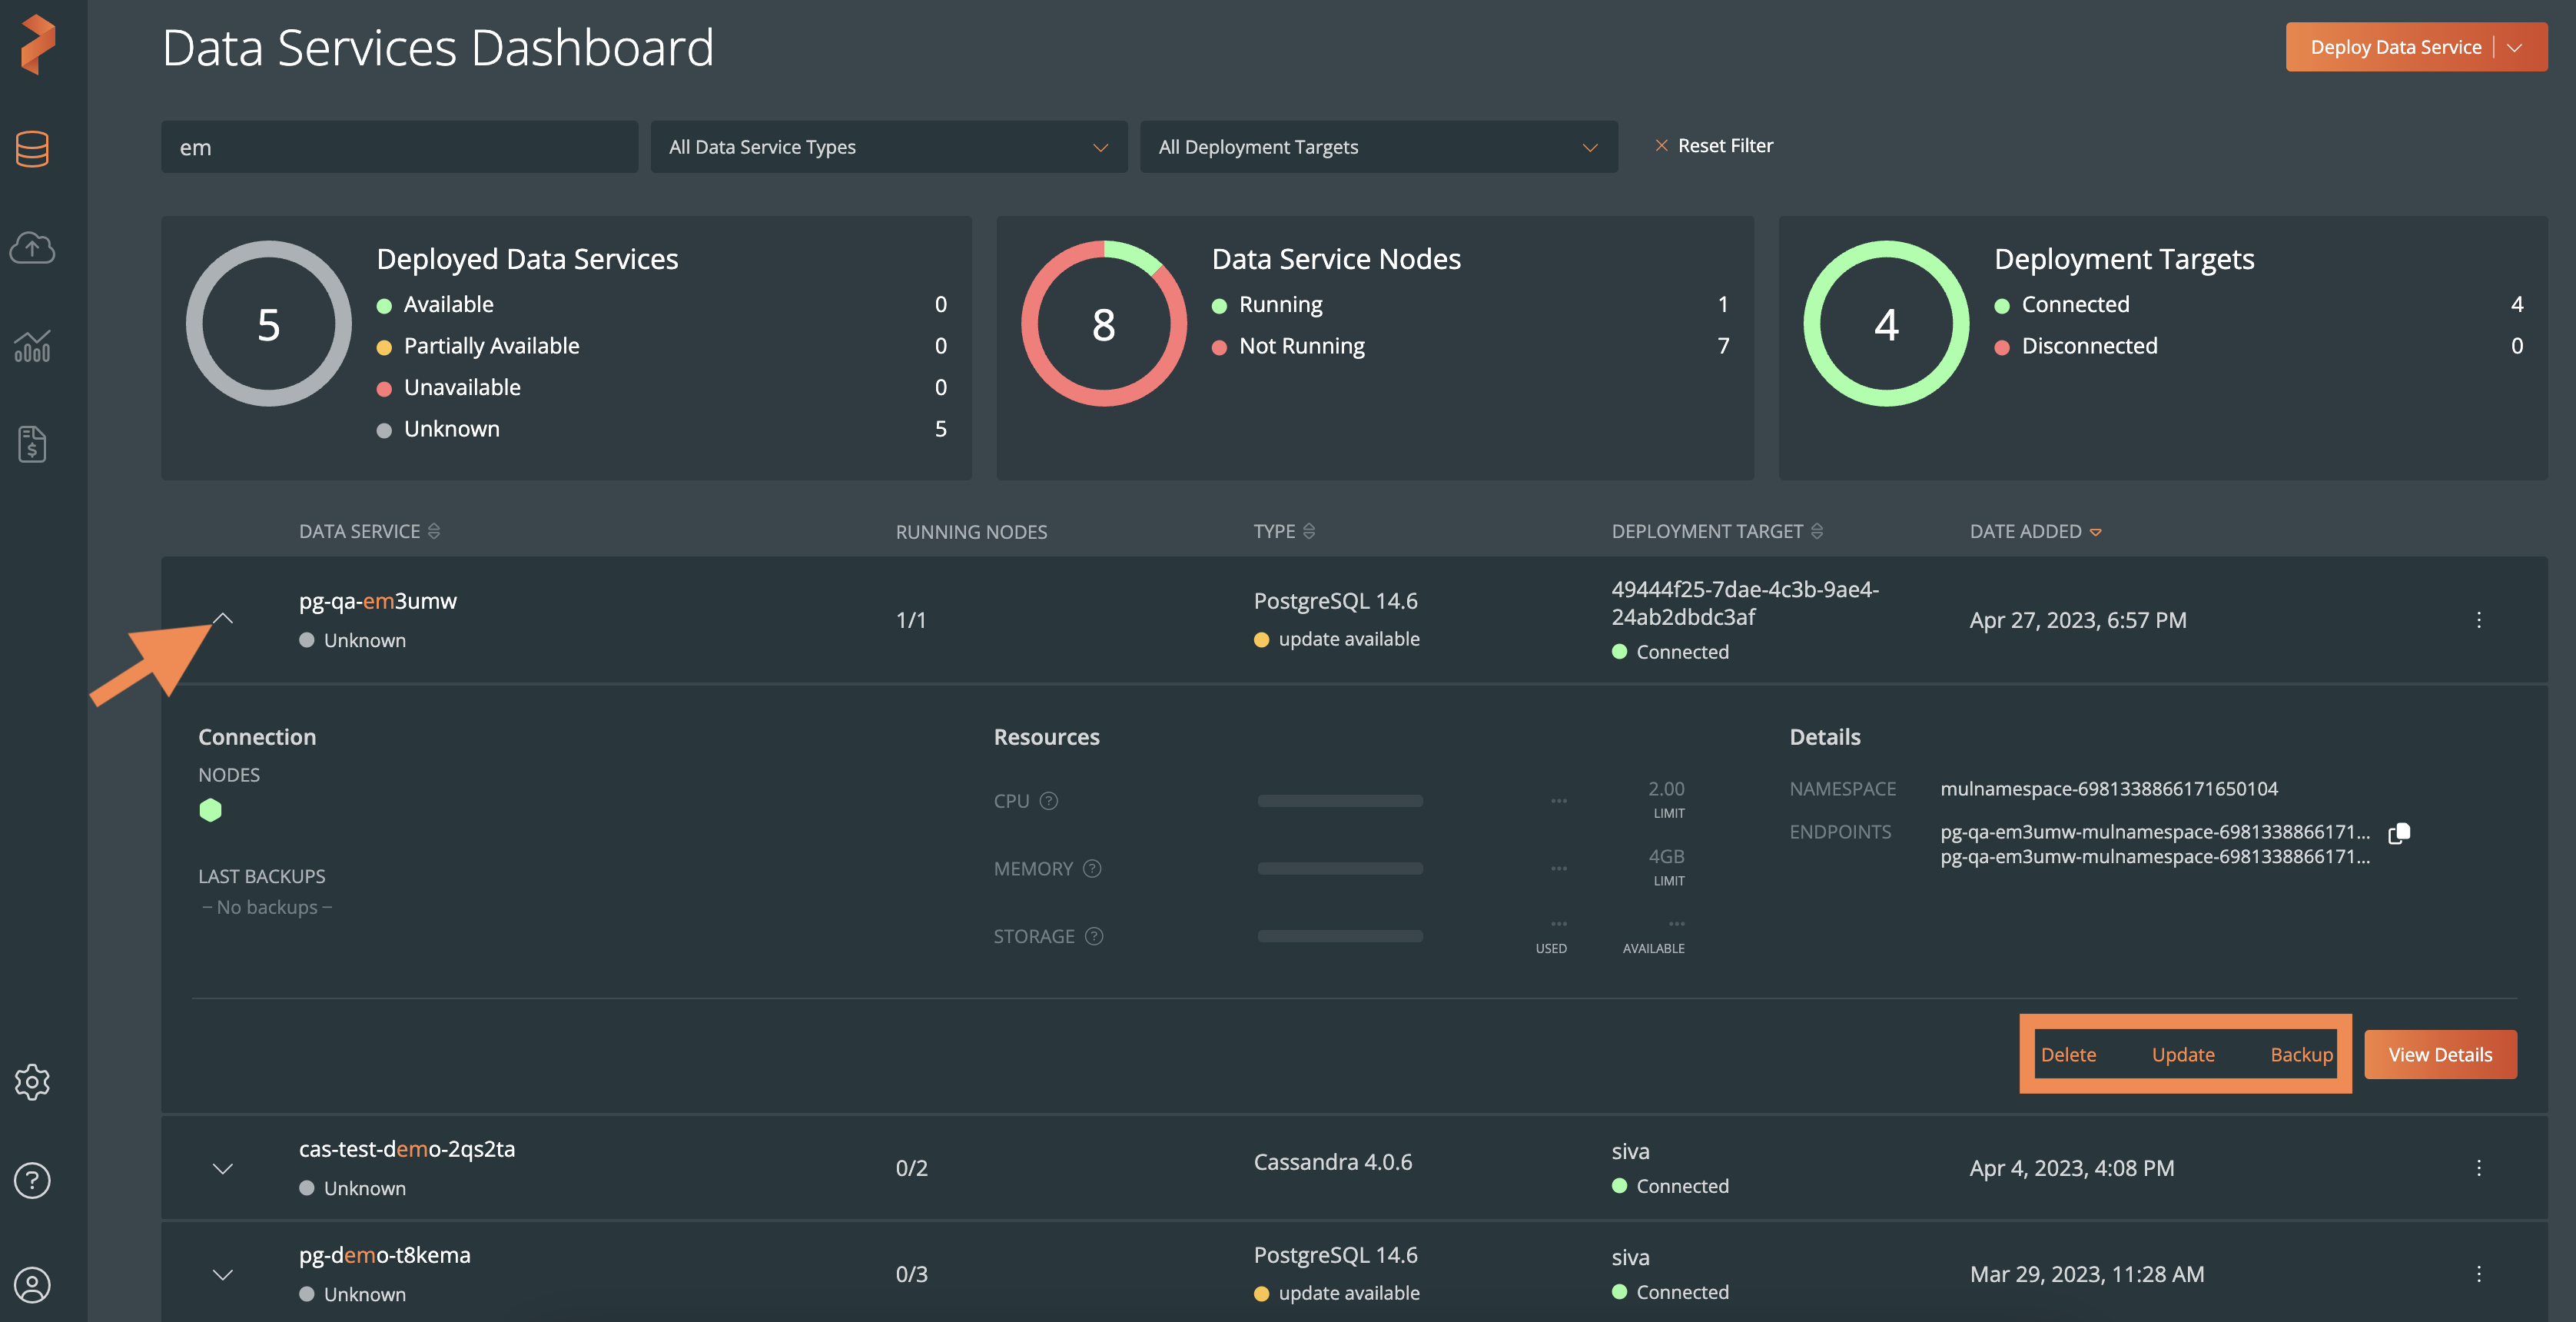
Data services dashboard
The Data Services Dashboard, which appears by default when you login, provides you the list of all deployed data services. From the list, you can click on a data service to view the Deployment details page.
PDS displays the timestamp of the most recent status update for a healthy data service when you hover over it. If there is a significant time difference between the current time and the last update time, it could suggest that the status check is not synchronized, which could be a result of a disconnected connection with the target. Consequently, the current status displayed for the deployment may not be dependable.
Filter options
The Data Services Dashboard includes search options to filter data services by name, type and deployment target. Moreover, the following widgets help you search using the statuses of:
- Deployed Data Services: Click on any of the available statuses to filter and display the corresponding data services.
- Data Services Nodes: By selecting any of the available node statuses, you can filter and view the associated data services. Note that when you click the Running filter option, the Not Running nodes are also displayed and vice versa. This happens because these nodes are available in the same deployment target.
- Deployment Targets: You can filter and view the relevant data services by selecting any of the available target cluster statuses. Note that if you select the Connected option, the Disconnected deployment targets will also be visible and vice versa. This occurs because certain disconnected data services are deployed within the same deployment target.
Perform data service operations
When you expand a data service, PDS provides an overview about the data service, such as:
- the connected nodes
- backup information
- resources used
- the namespace and endpoint details
Moreover, the Backup, Delete, and Update (available only if there is an update available) icons help you perform specific operations on the data service:
