Monitor clusters using Portworx Central on-premises
From Portworx Central, you can monitor one or more Portworx clusters and view the following information.
- Health of your nodes, volumes, and drives
- Used and available capacity
- Current volumes, drives, pools, and snapshots
Prerequisites
- Add at least one cluster to Portworx Central. See the Add clusters to Portworx Central On-prem page for details.
Monitor your Portworx cluster
-
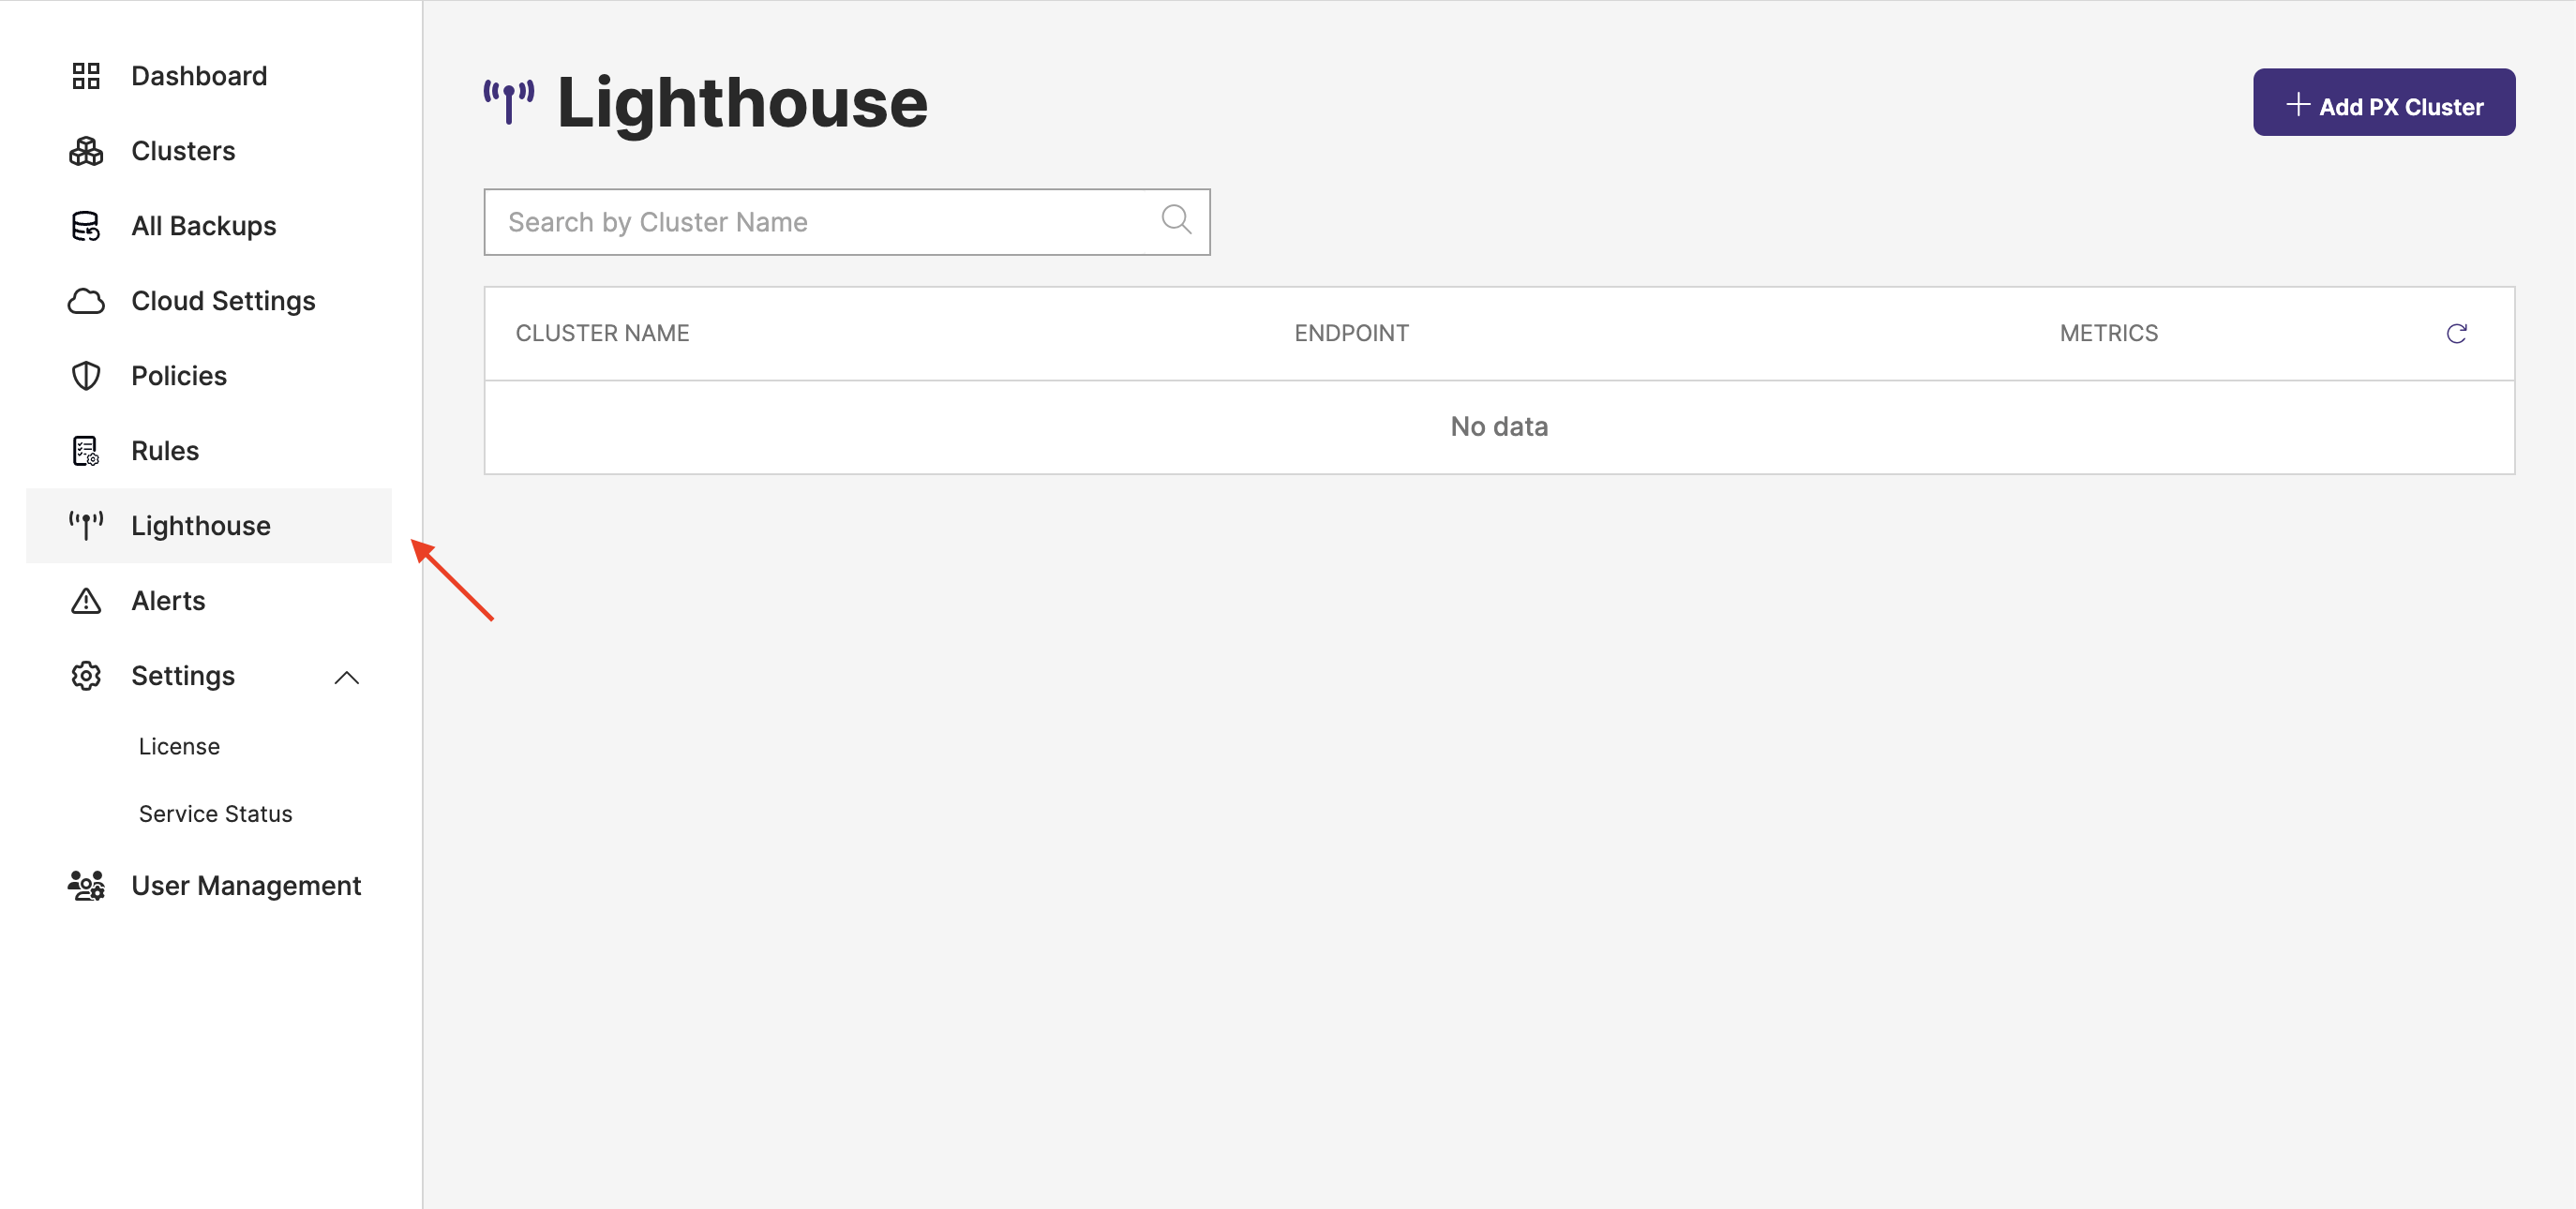
From the PX-Central home page, select the Lighthouse icon:
-
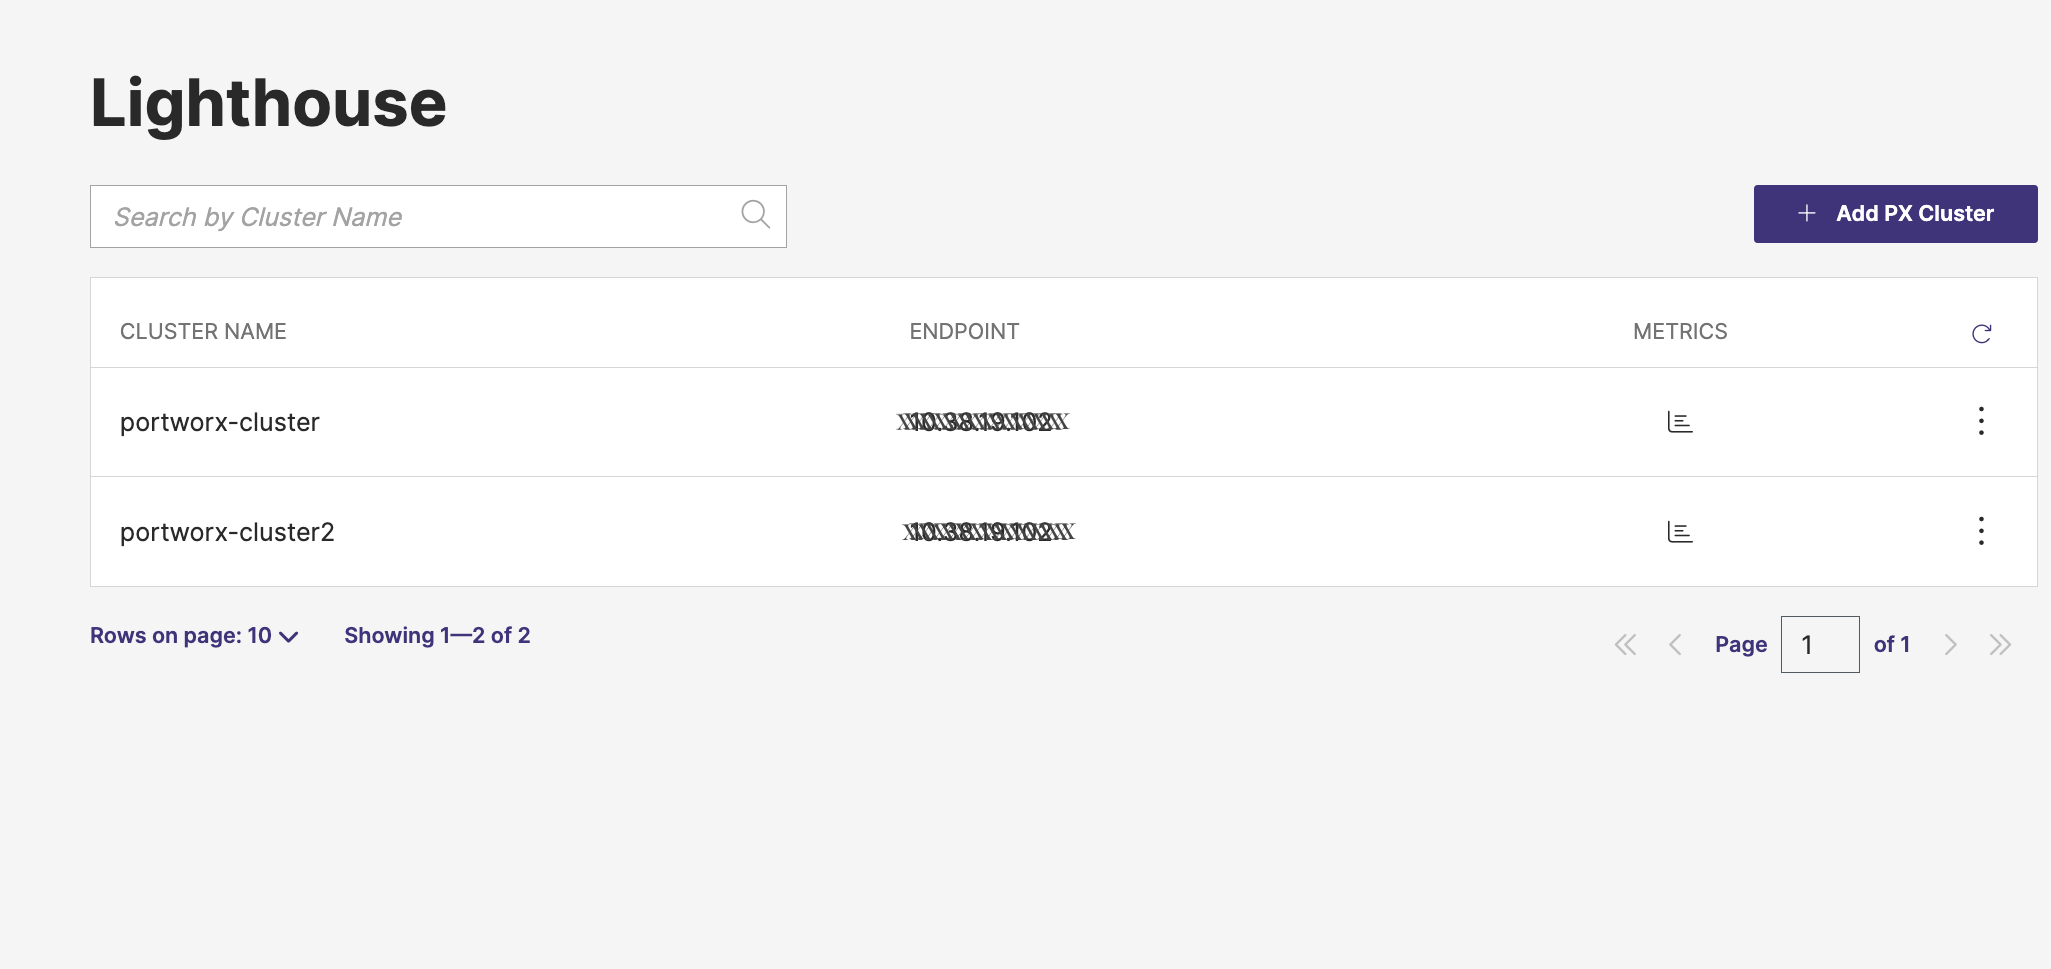
Select your cluster, to navigate to the cluster details page.
-
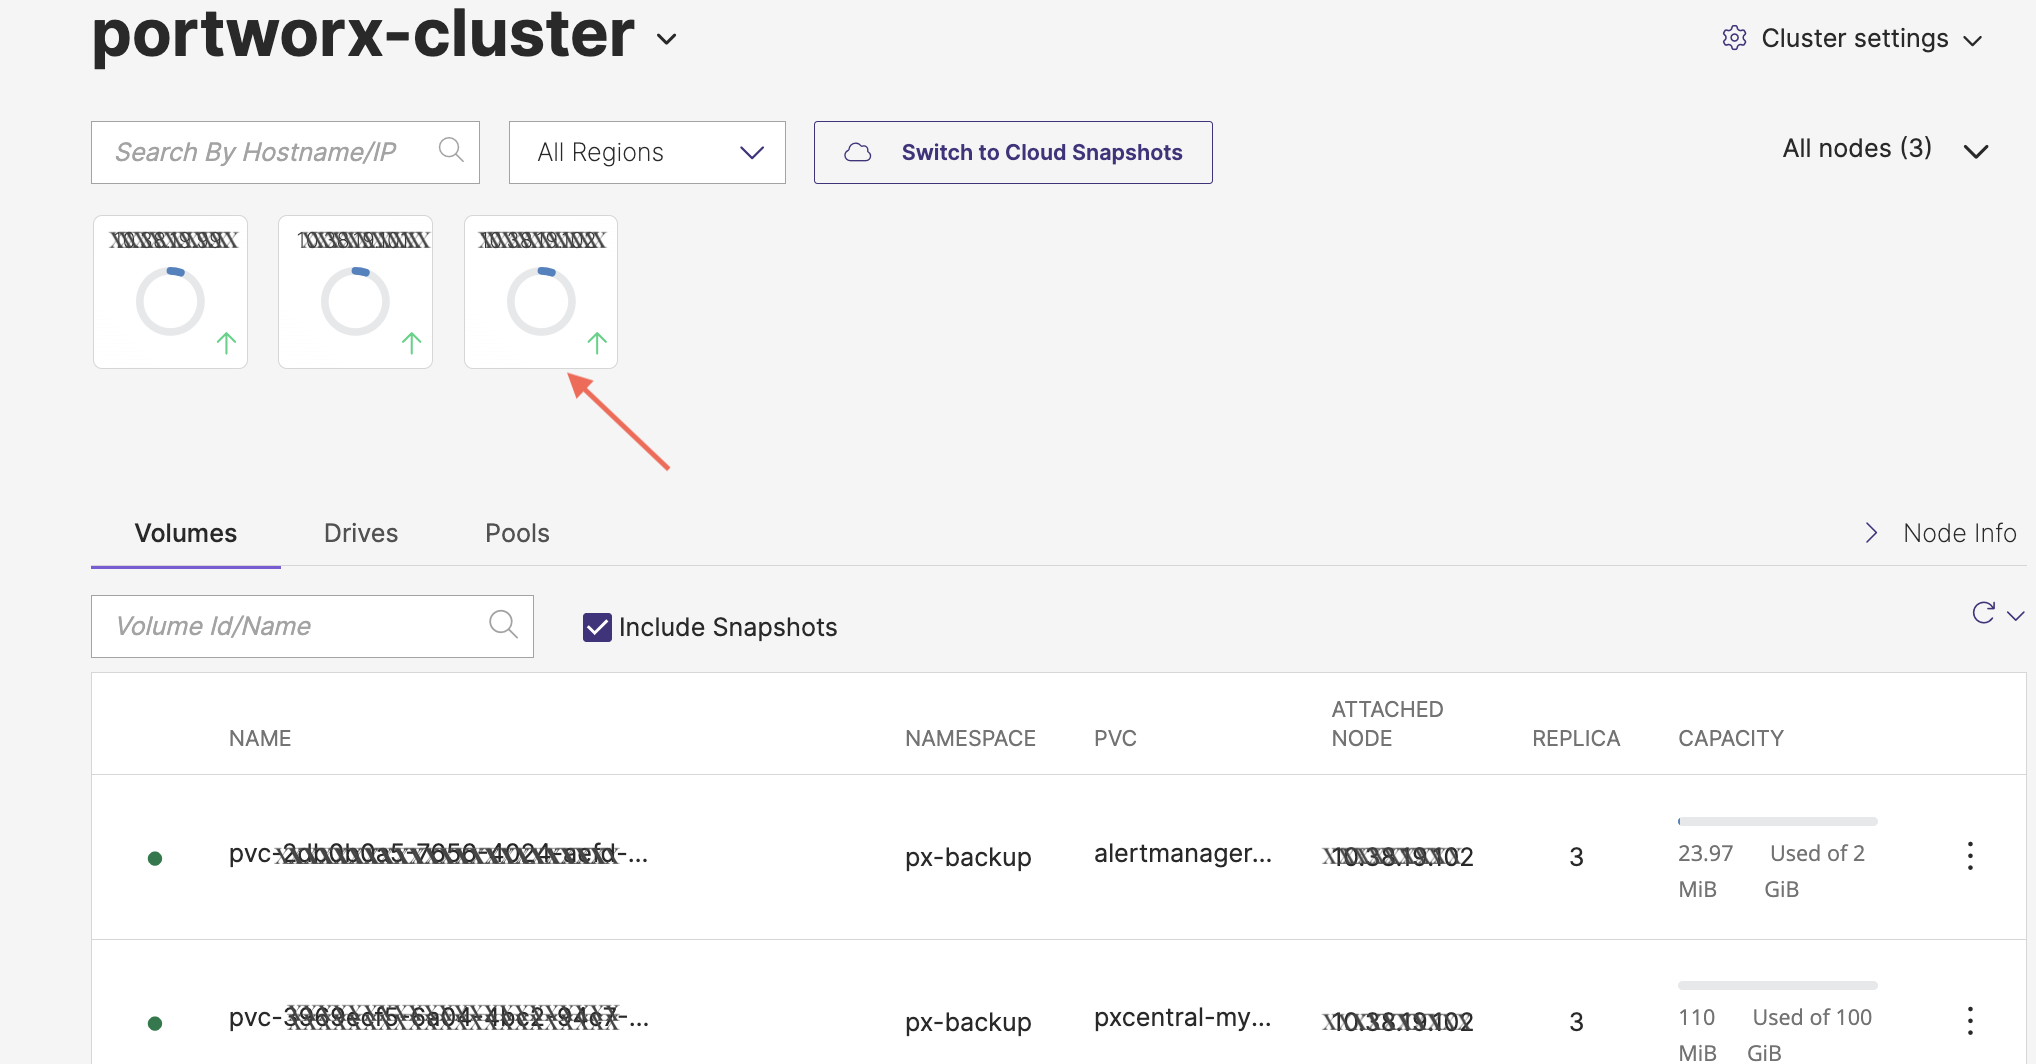
Select a node to view detailed information about your volumes, drives, and pools.
View volume details
-
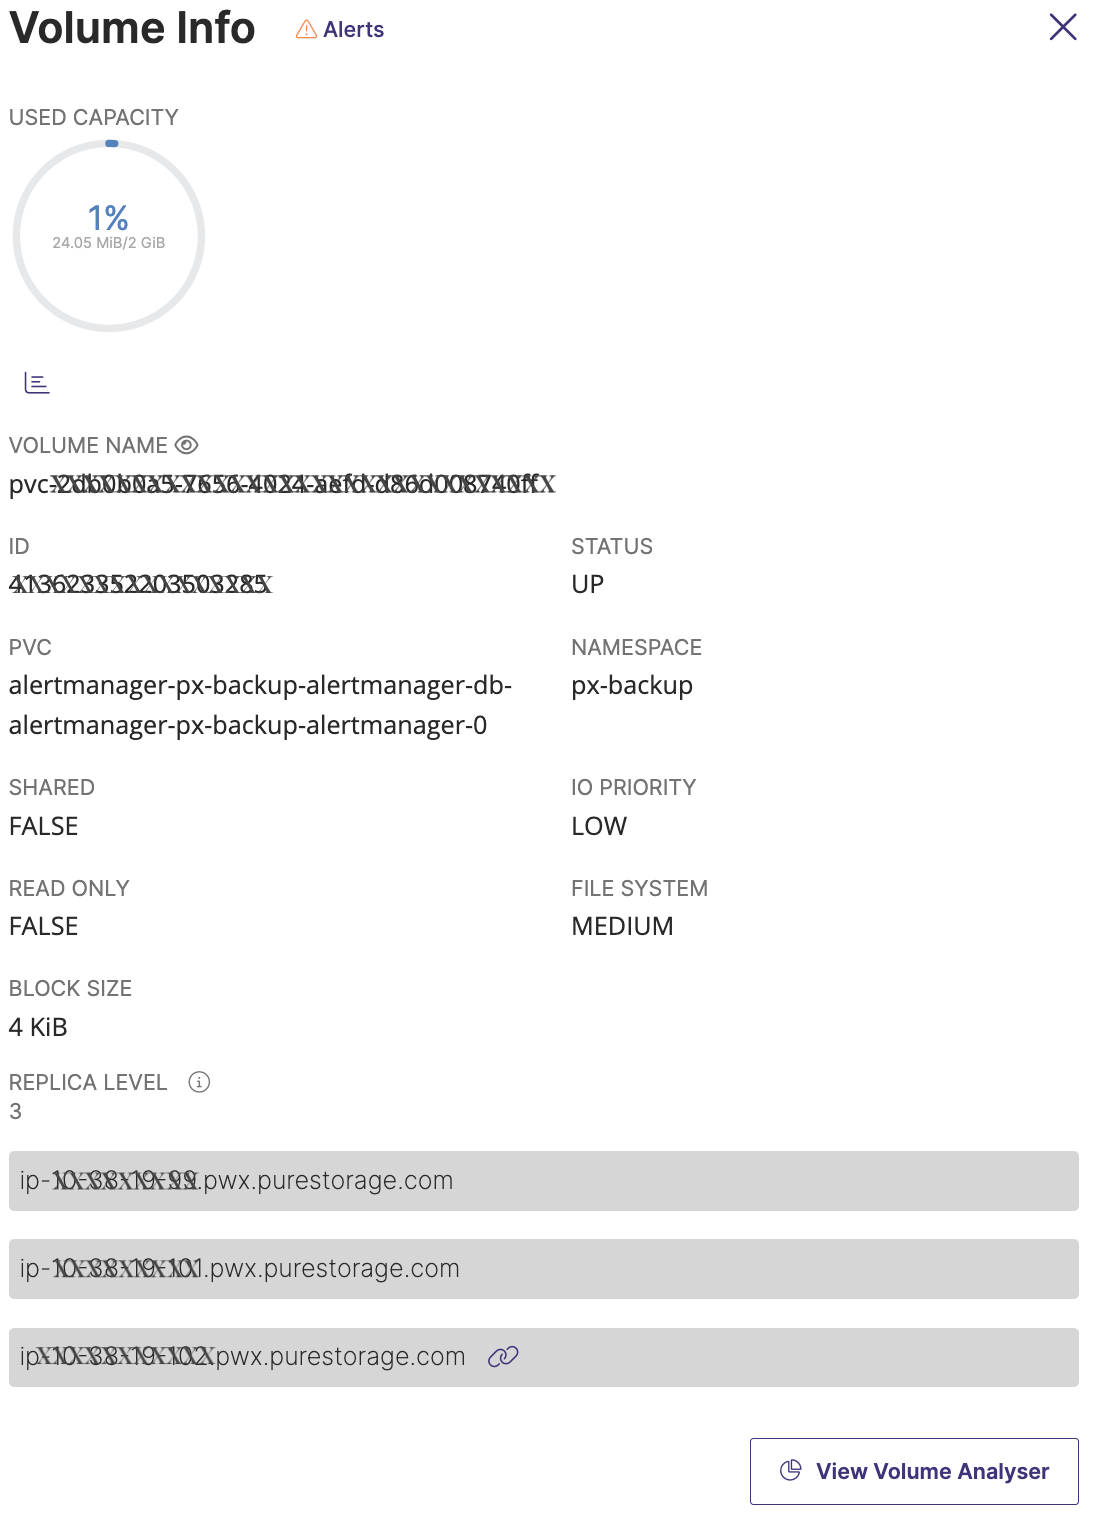
You can select a volume to view its details:
-
In the Volume Info window, select the View Volume Analyzer button to view the sunburst chart for the selected volume.
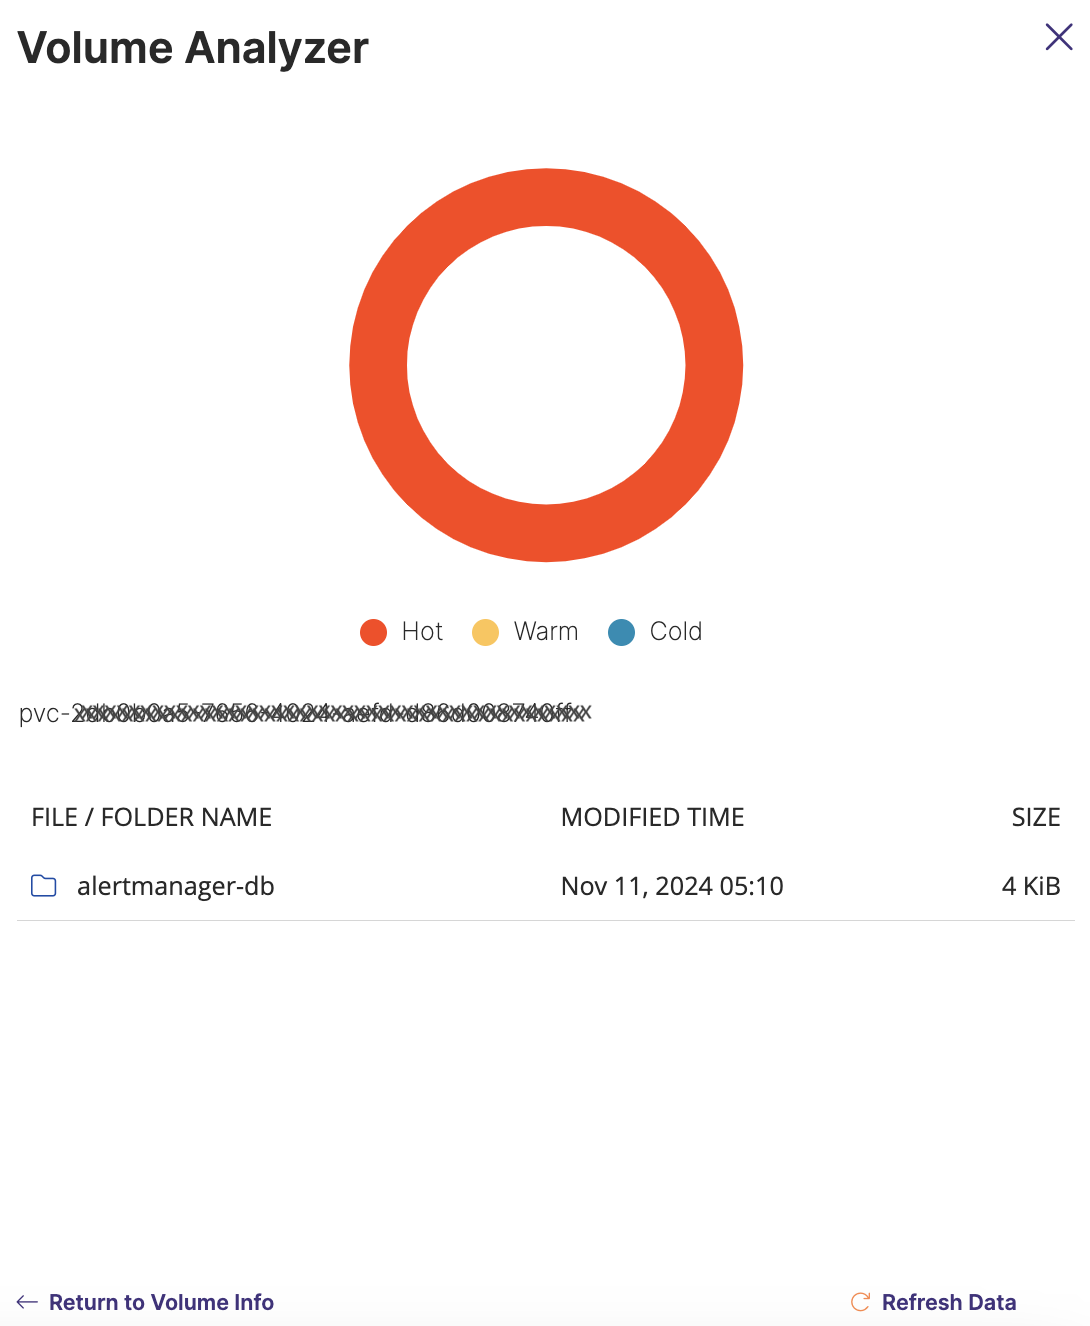
The Volume Analyzer displays folders and files stored in a volume, size of each folder and file, and the modified time for each file. The sunburst graph displays the following color codes to specify the time that you last modified a file or folder:
- Hot: less than 24 hours
- Warm: less than one week, but more than 24 hours
- Cold: more than one week