Deployed data service dashboard
This topic explains all features available in the deployment details page.
Prerequisites
- A deployed data service
From the Data Services Dashboard, you can view the deployment details page in one of the following ways:
Click on a data service.
Expand a data service, and then select the View Details button.
The deployment dashboard helps you view:
- the deployment status of your data service
- additional details regarding the connection, configuration, and resources used in your deployment
- deployment health: status and events occurred during the deployment process
jsonfiles for status and deployment details- the list of your backup jobs
From the dashboard, you can also:
- update a data service
- manage or edit the data service
- backup a data service (ad-hoc or scheduled)
- view metrics
Deployment health states
PDS displays the following states to assist you in assessing the readiness of a data service for use:
- Available: Once the number of ready replicas matches the desired number of replicas for deployment.
- Partially Available: When the deployment has 1 or more ready replicas but fewer than the specified number of desired replicas.
- Unavailable: If there are no ready replicas in a deployment or if the restoration process is ongoing.
- Unknown: PDS is unable to determine the deployment health status currently.
View node(s) status
You can hover over the node hexagons to view the status of pod(s). PDS displays the pod(s) in the following colors to let you know the status:
- Green: pod is running
- Yellow: pod is coming up
- Gray: pod is yet to come up
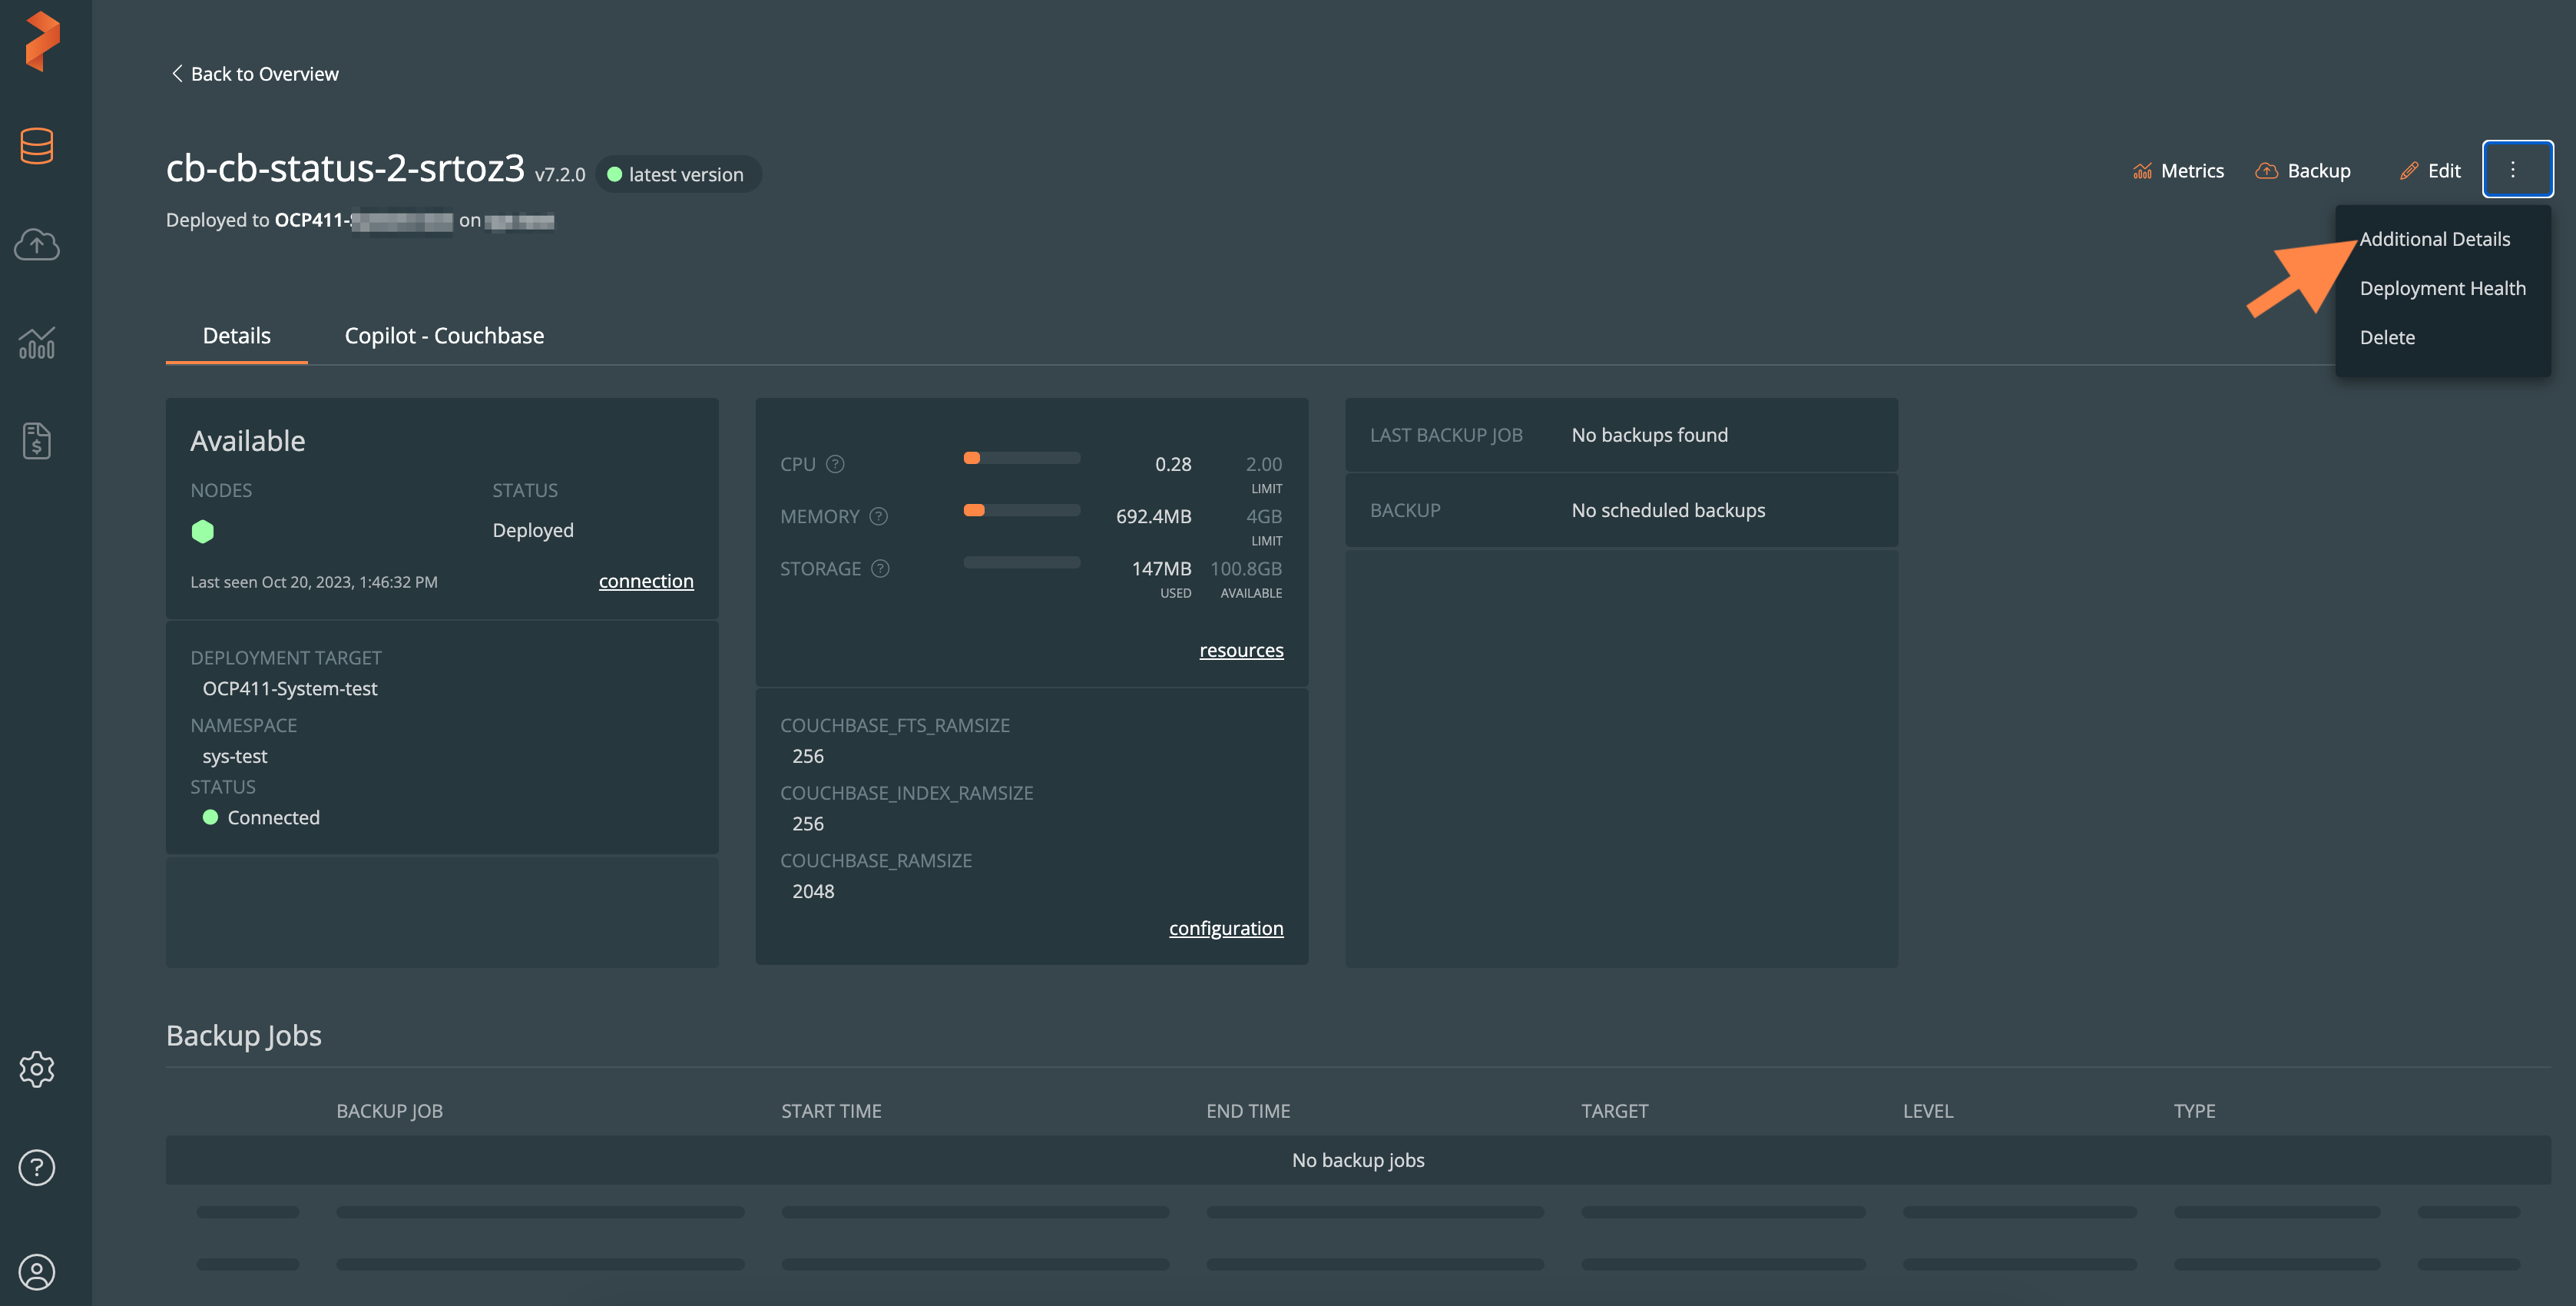
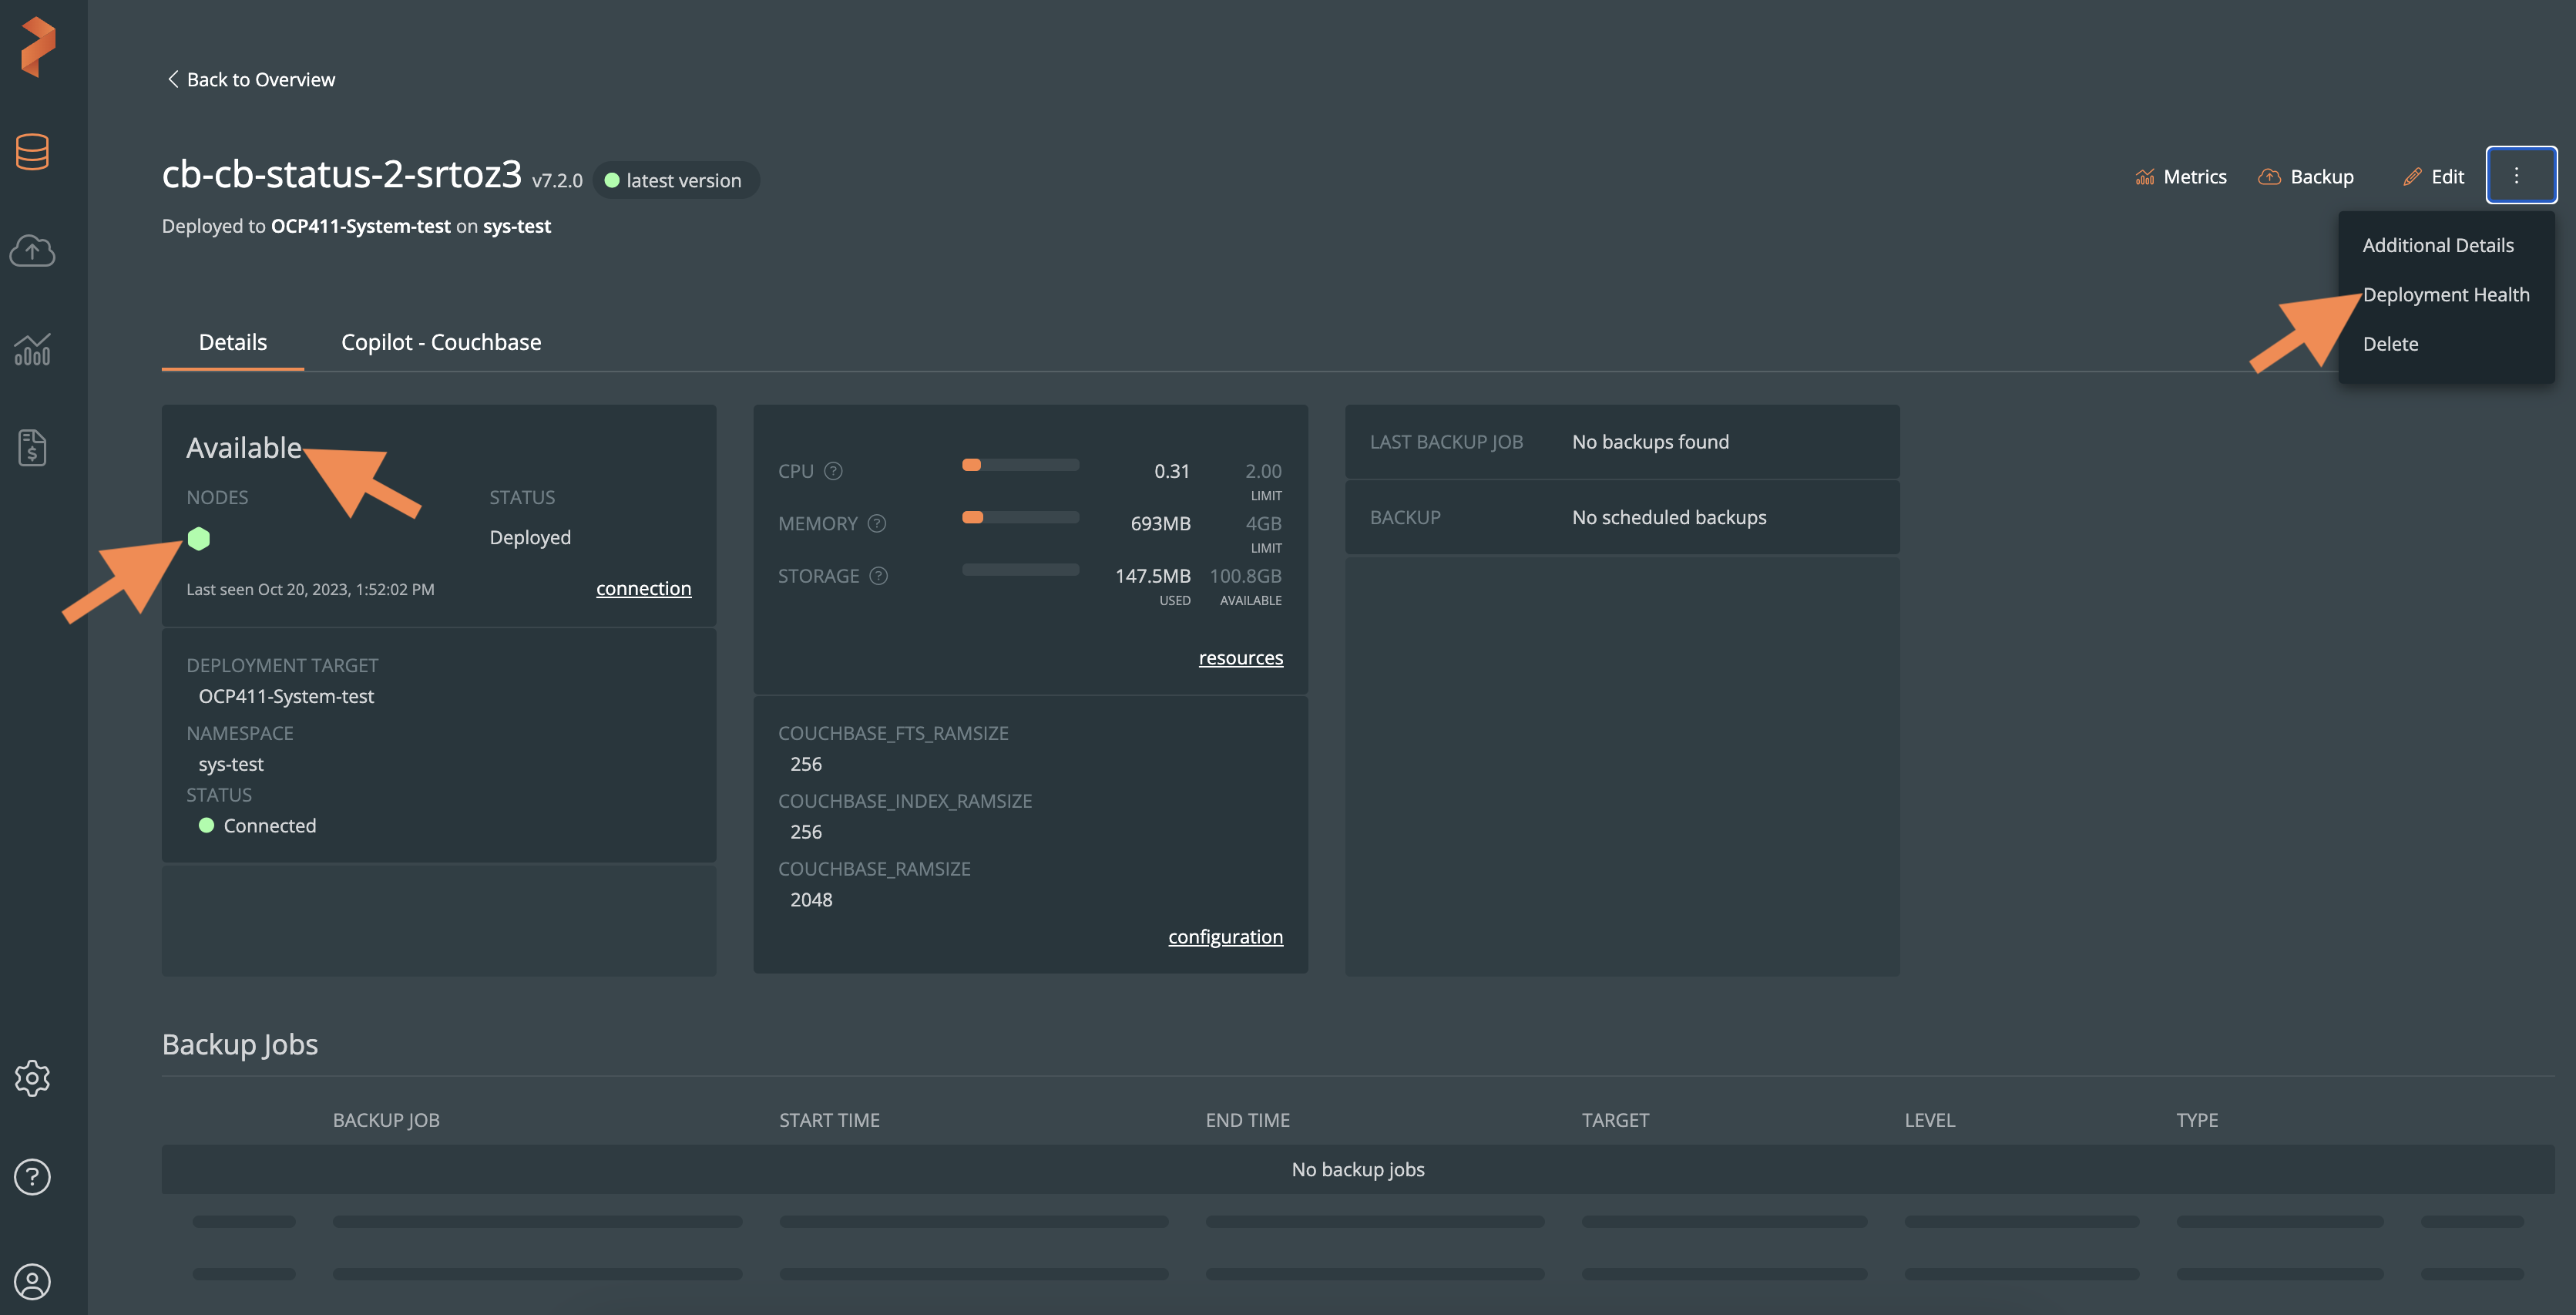
View additional details
The Additional Details window provides the Connection, Configuration, and Resources details used by a deployment.
To view the Additional Details window:
Select the vertical ellipsis button next to Edit.
From the options, select View Additional Details.
Connection
By default, the Connection tab is selected in the Additional Details window:
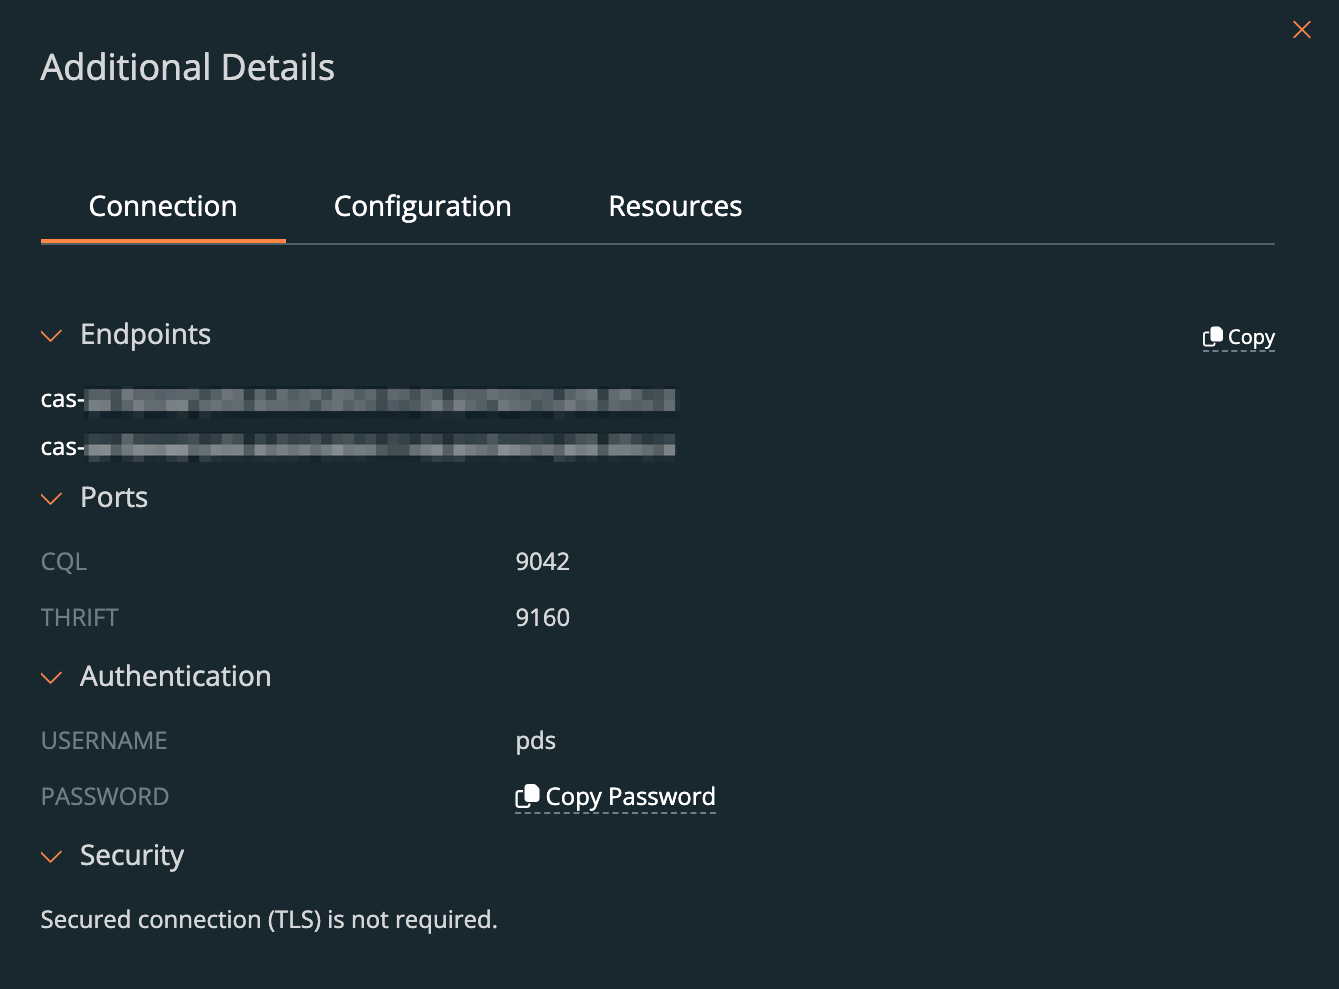
The Connection tab displays:
- Ports: the open ports used for a specific deployment.
- Authentication: the credentials (username and password) for a deployment.
- Nodes: all the running nodes in a deployment.
Some PDS functionality is dependent on database access. Examples include monitoring and backups. If you change the password for the pds user, you need to also update the corresponding Kubernetes secret for the deployment. The secret can be found in the namespace with the name <DEPLOYMENT-NAME>-creds.
For more information, see Update Kubernetes secret after changing the pds password.
You can also select the connection button, below the node hexagons, to directly access the Connection tab.
Configuration
The Configuration tab displays more information about the deployment, DNS zone, and load balancer ranges for the deployed data service.
To view the configuration details, perform one of the following tasks:
Select the Configurations tab in the Additional Details window:
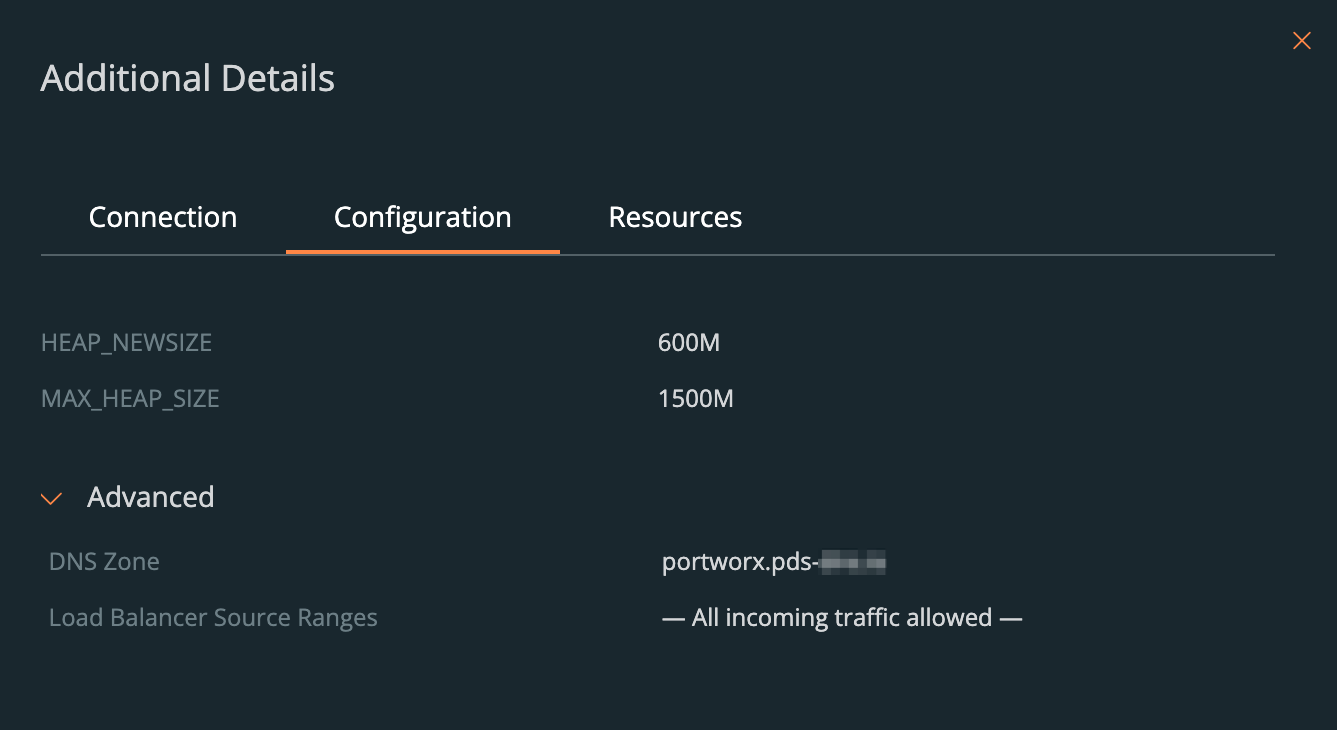
Select the button in the configuration details section.
Resources
The Resources tab displays the:
- sum of CPU utilization, memory, and storage used by all nodes
- maximum available CPU and memory limits for a specific deployment
To view the resources details, perform one of the following tasks:
Select the Resources tab in the Additional Details window:
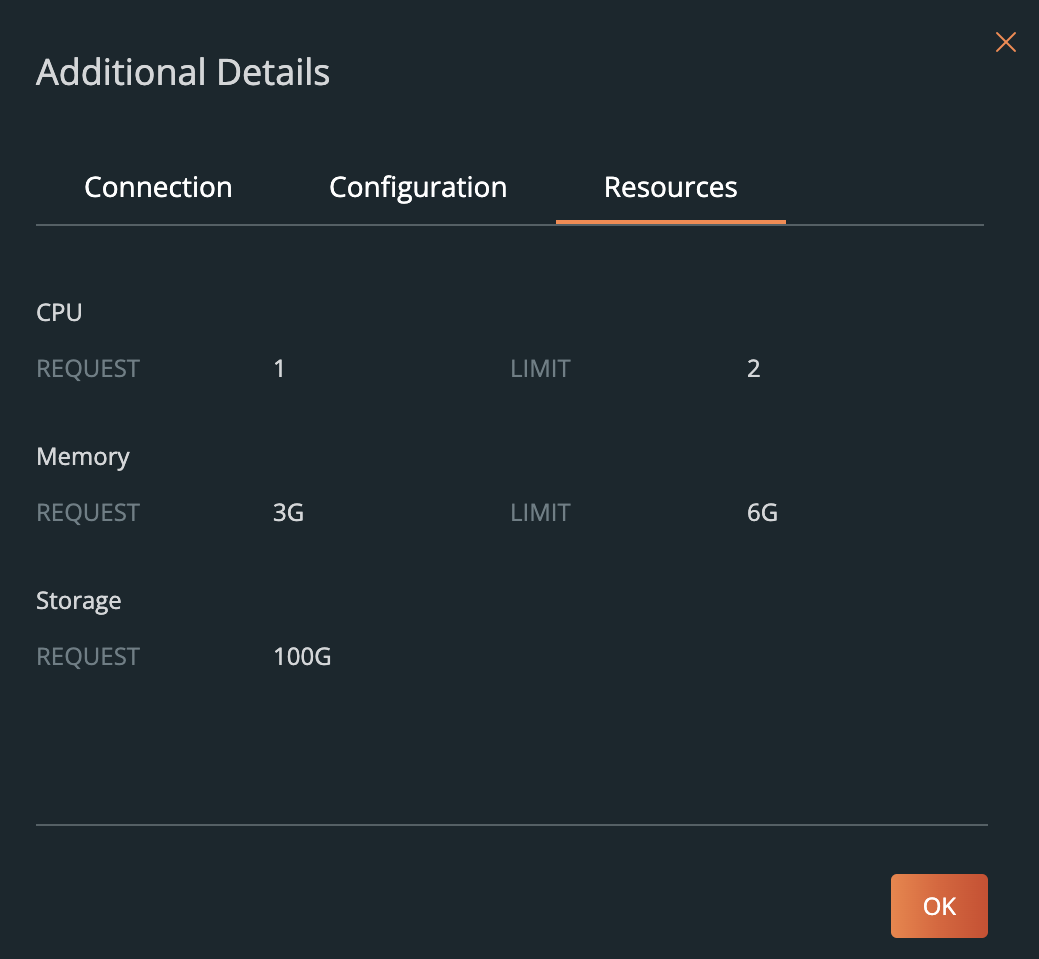
Select the resources button in the resources details section.
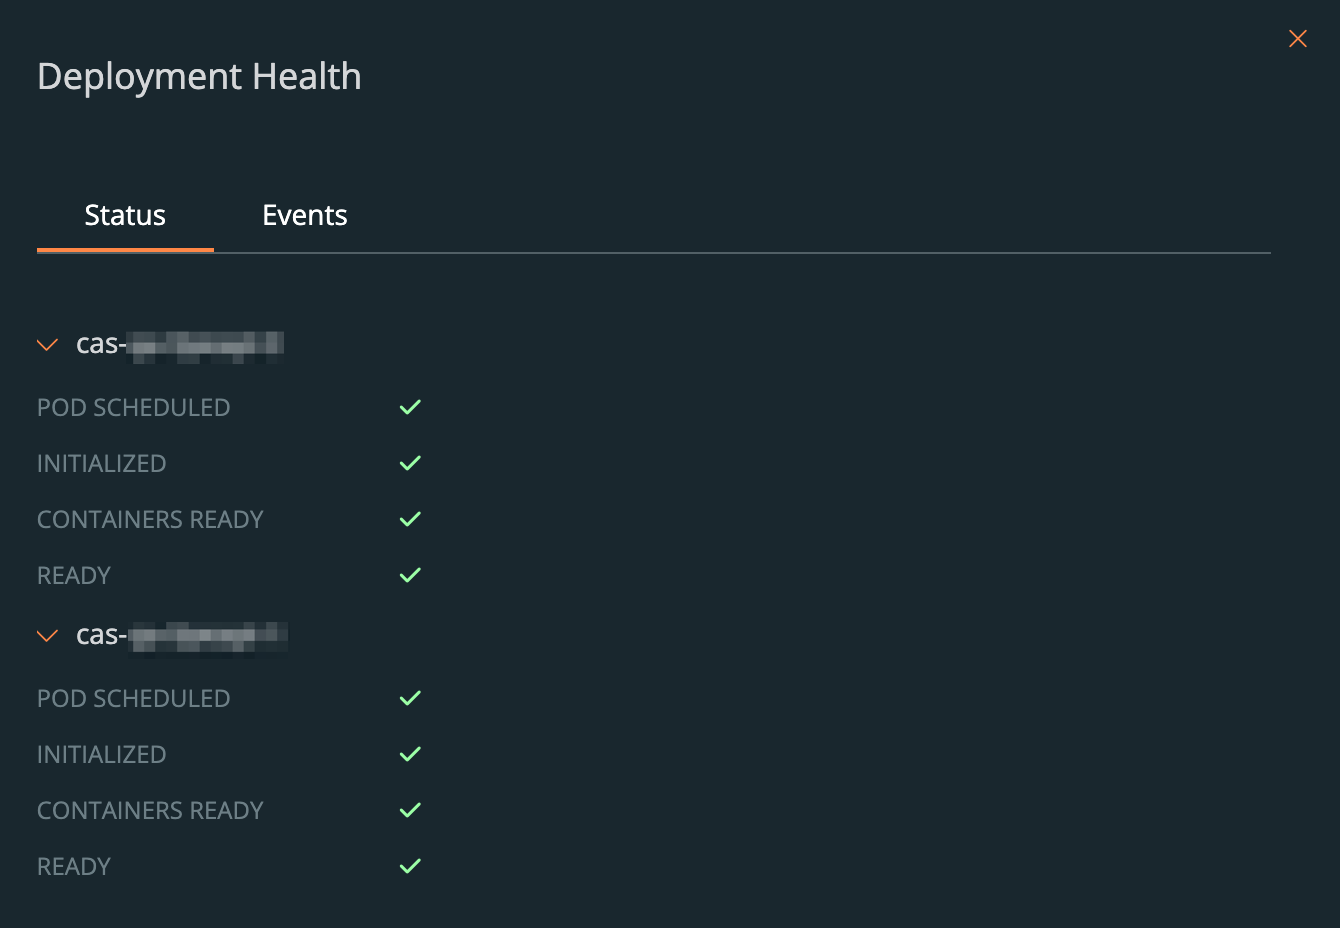
View deployment health
The Deployment Health window provides more information about the status of your deployment and the real-time events that occurred during the deployment.
To view the Deployment Health window:
- In the Deployments page, select a deployed data service.
- In the deployment dashboard, select the vertical ellipsis button next to Edit.
- From the options, select View Deployment Health.
You can also select the deployment status and the nodes status to view the Deployment Health window:
By default, the Status tab is selected in the Deployment Health window:
Select the Events tab or all events in the connection section to view the events that occurred during the deployment:
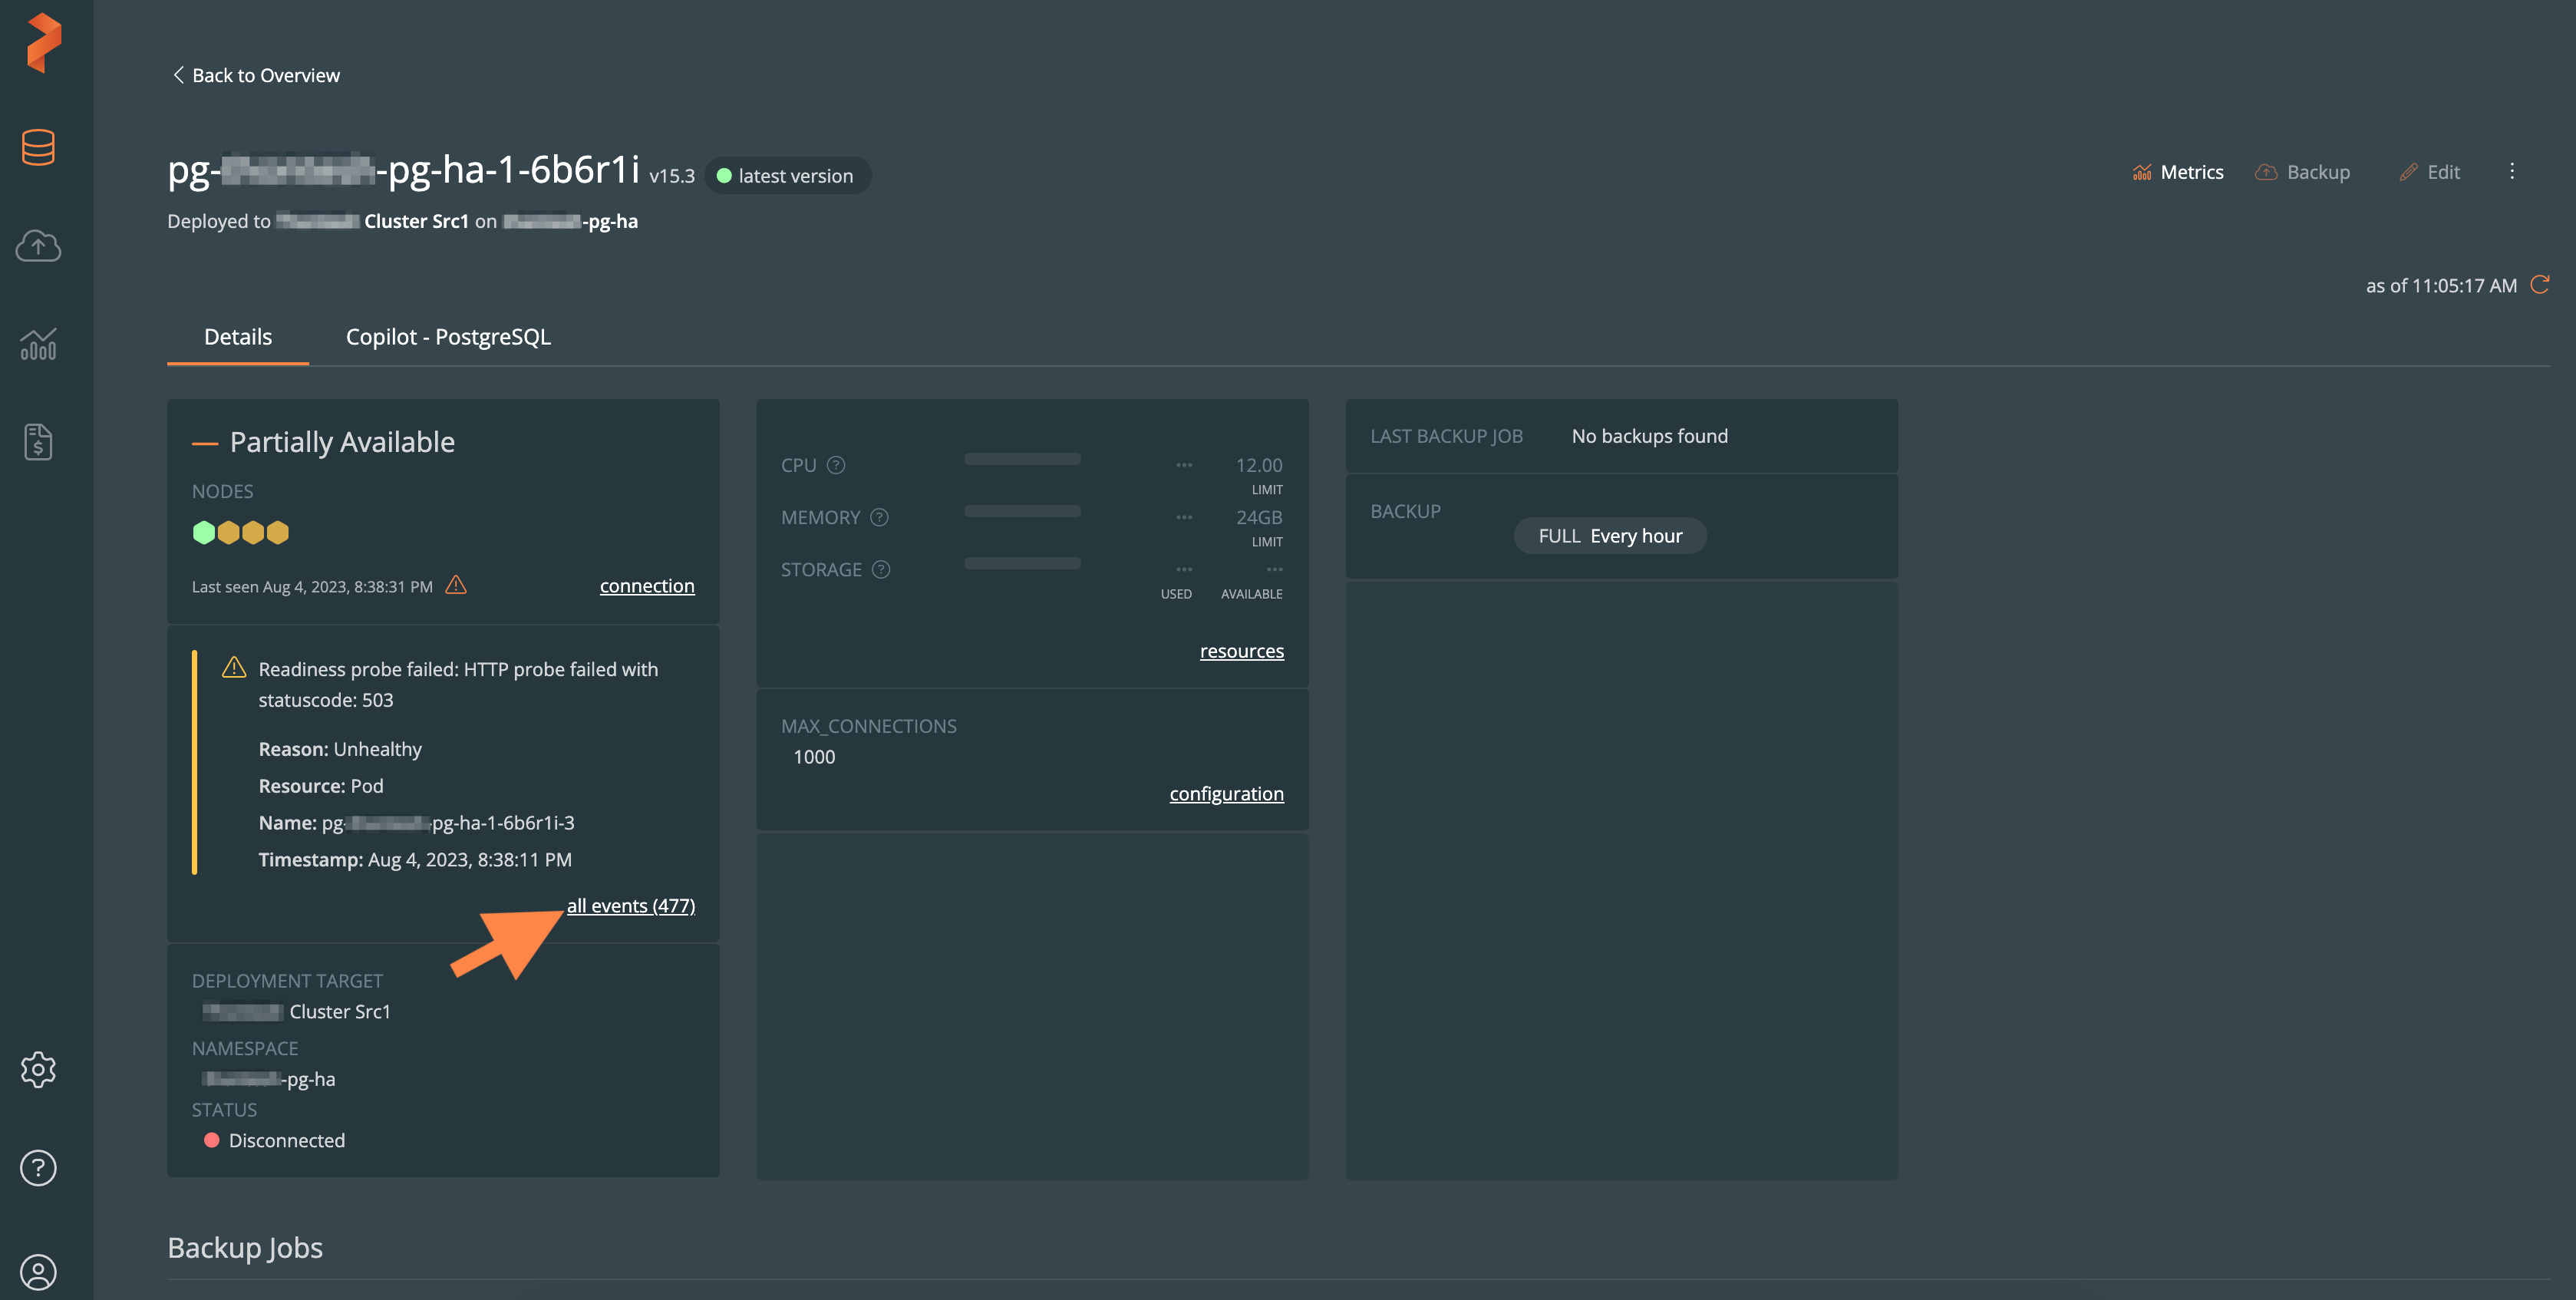
Deployment specific events are displayed under the Events tab:
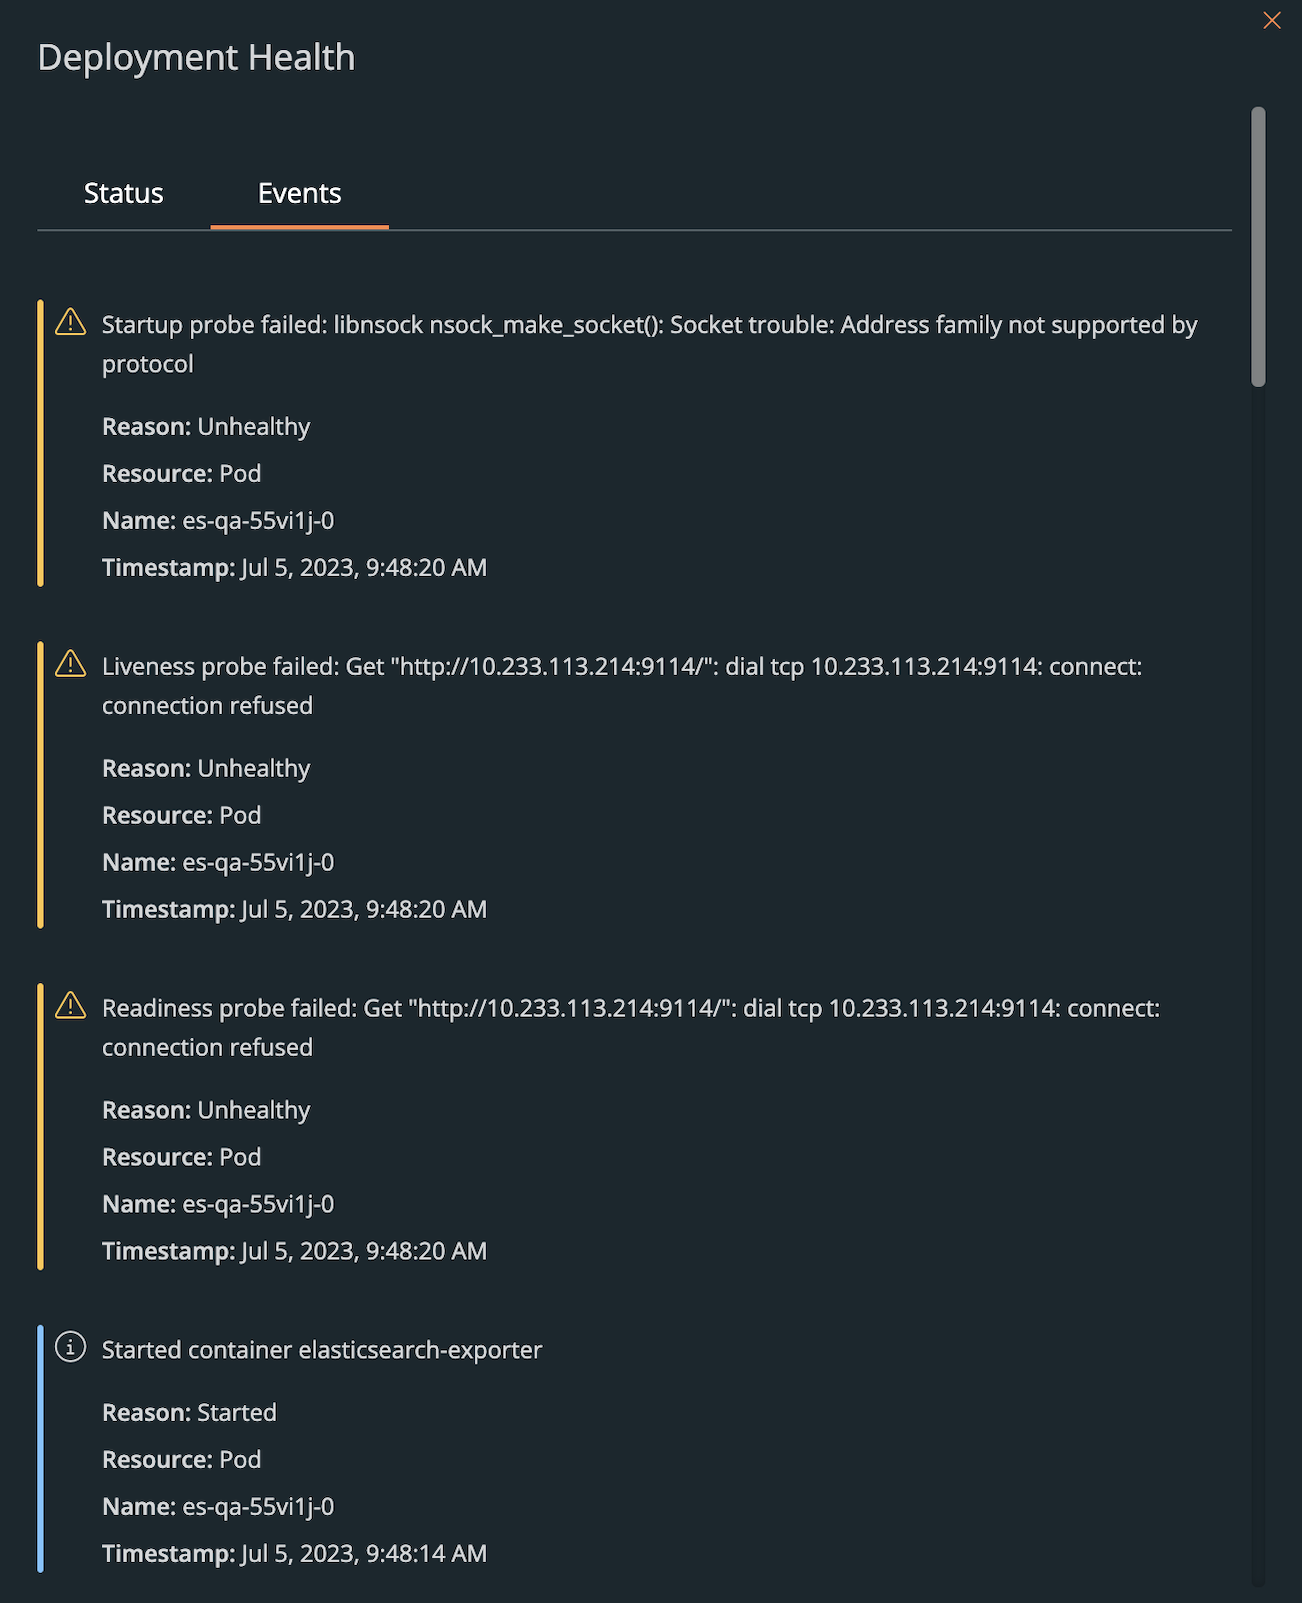
Previously, events were only stored for 60 minutes making it difficult to troubleshoot deployment-related issues. From PDS release 119:
- All events are stored for 7 days.
- New events are appended to the event log preventing overwriting of old events.
The target cluster version must be 1.18.2 or newer for PDS to display the improved events.
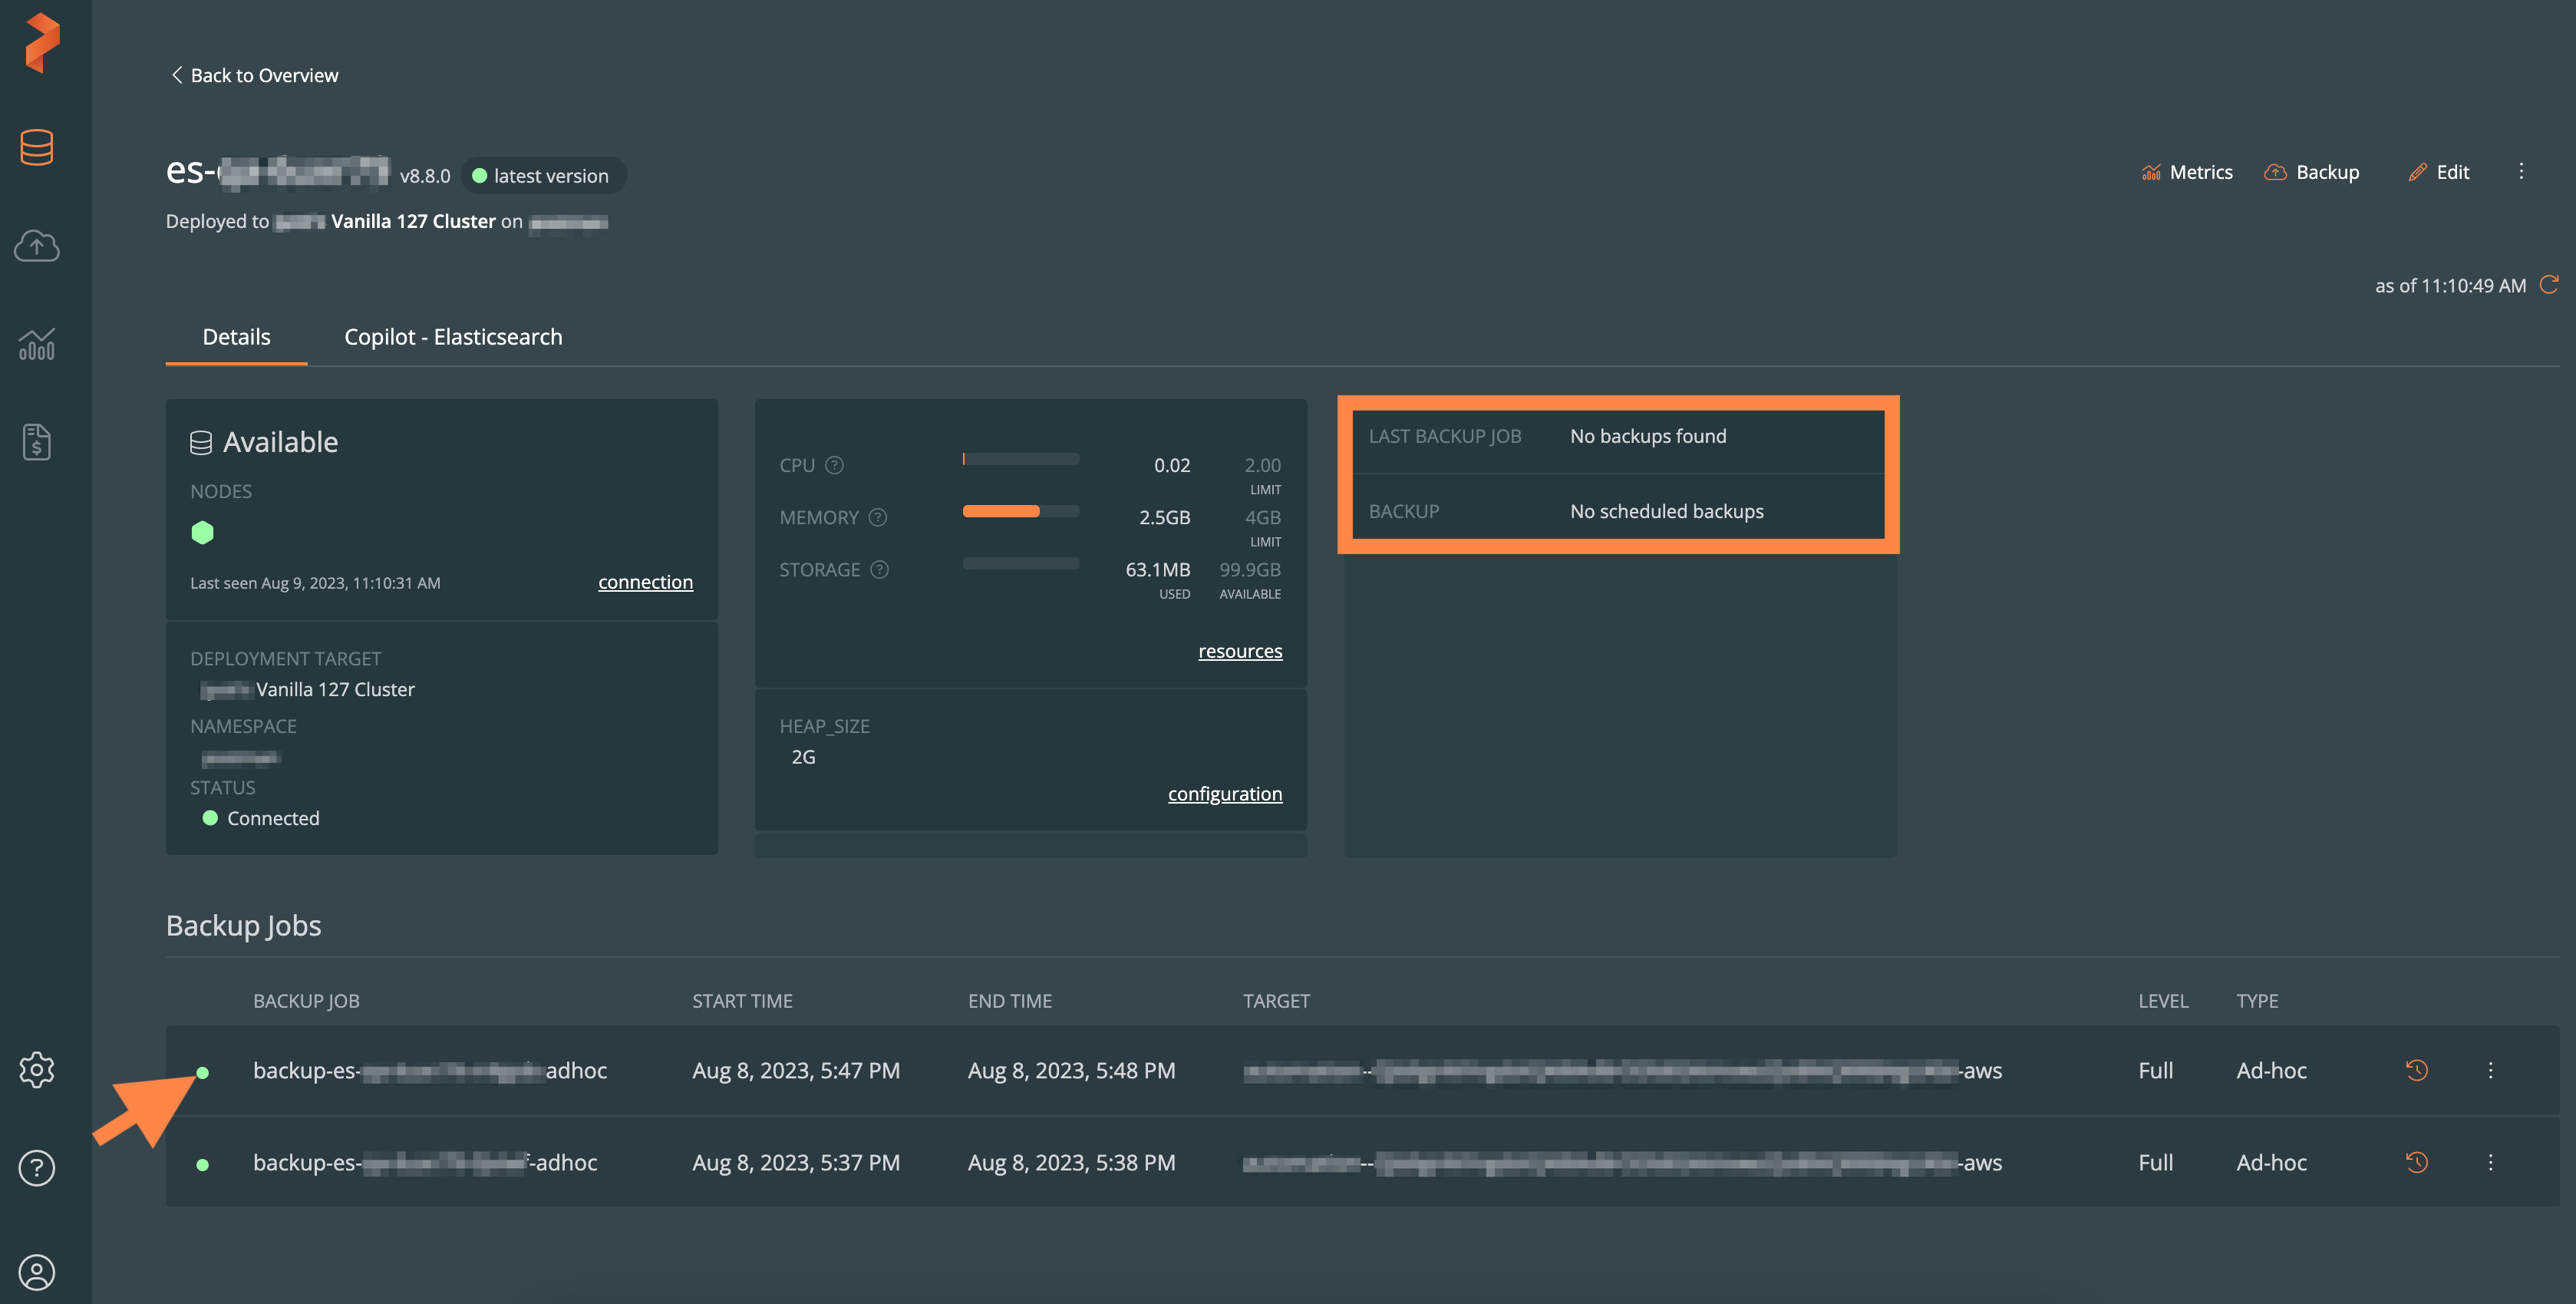
Backup jobs
In PDS, you can backup Cassandra, Consul, Couchbase, Elasticsearch, MongoDB Enterprise, MySQL, PostgreSQL, and Redis data services.
The following labels in the deployment details page help you know the backup job details:
- LAST BACKUP JOB: time when the last backup was performed
- BACKUP: frequency of a specific backup
You can also view all scheduled and ad-hoc backups that belong to a deployment in the dashboard.
Each backup displays the backup name, start and end time, backup target location, and the backup type:
Metrics
PDS provides built-in dashboards for monitoring the common usage scenarios for your data services. To view the built-in dashboards, select Metrics:
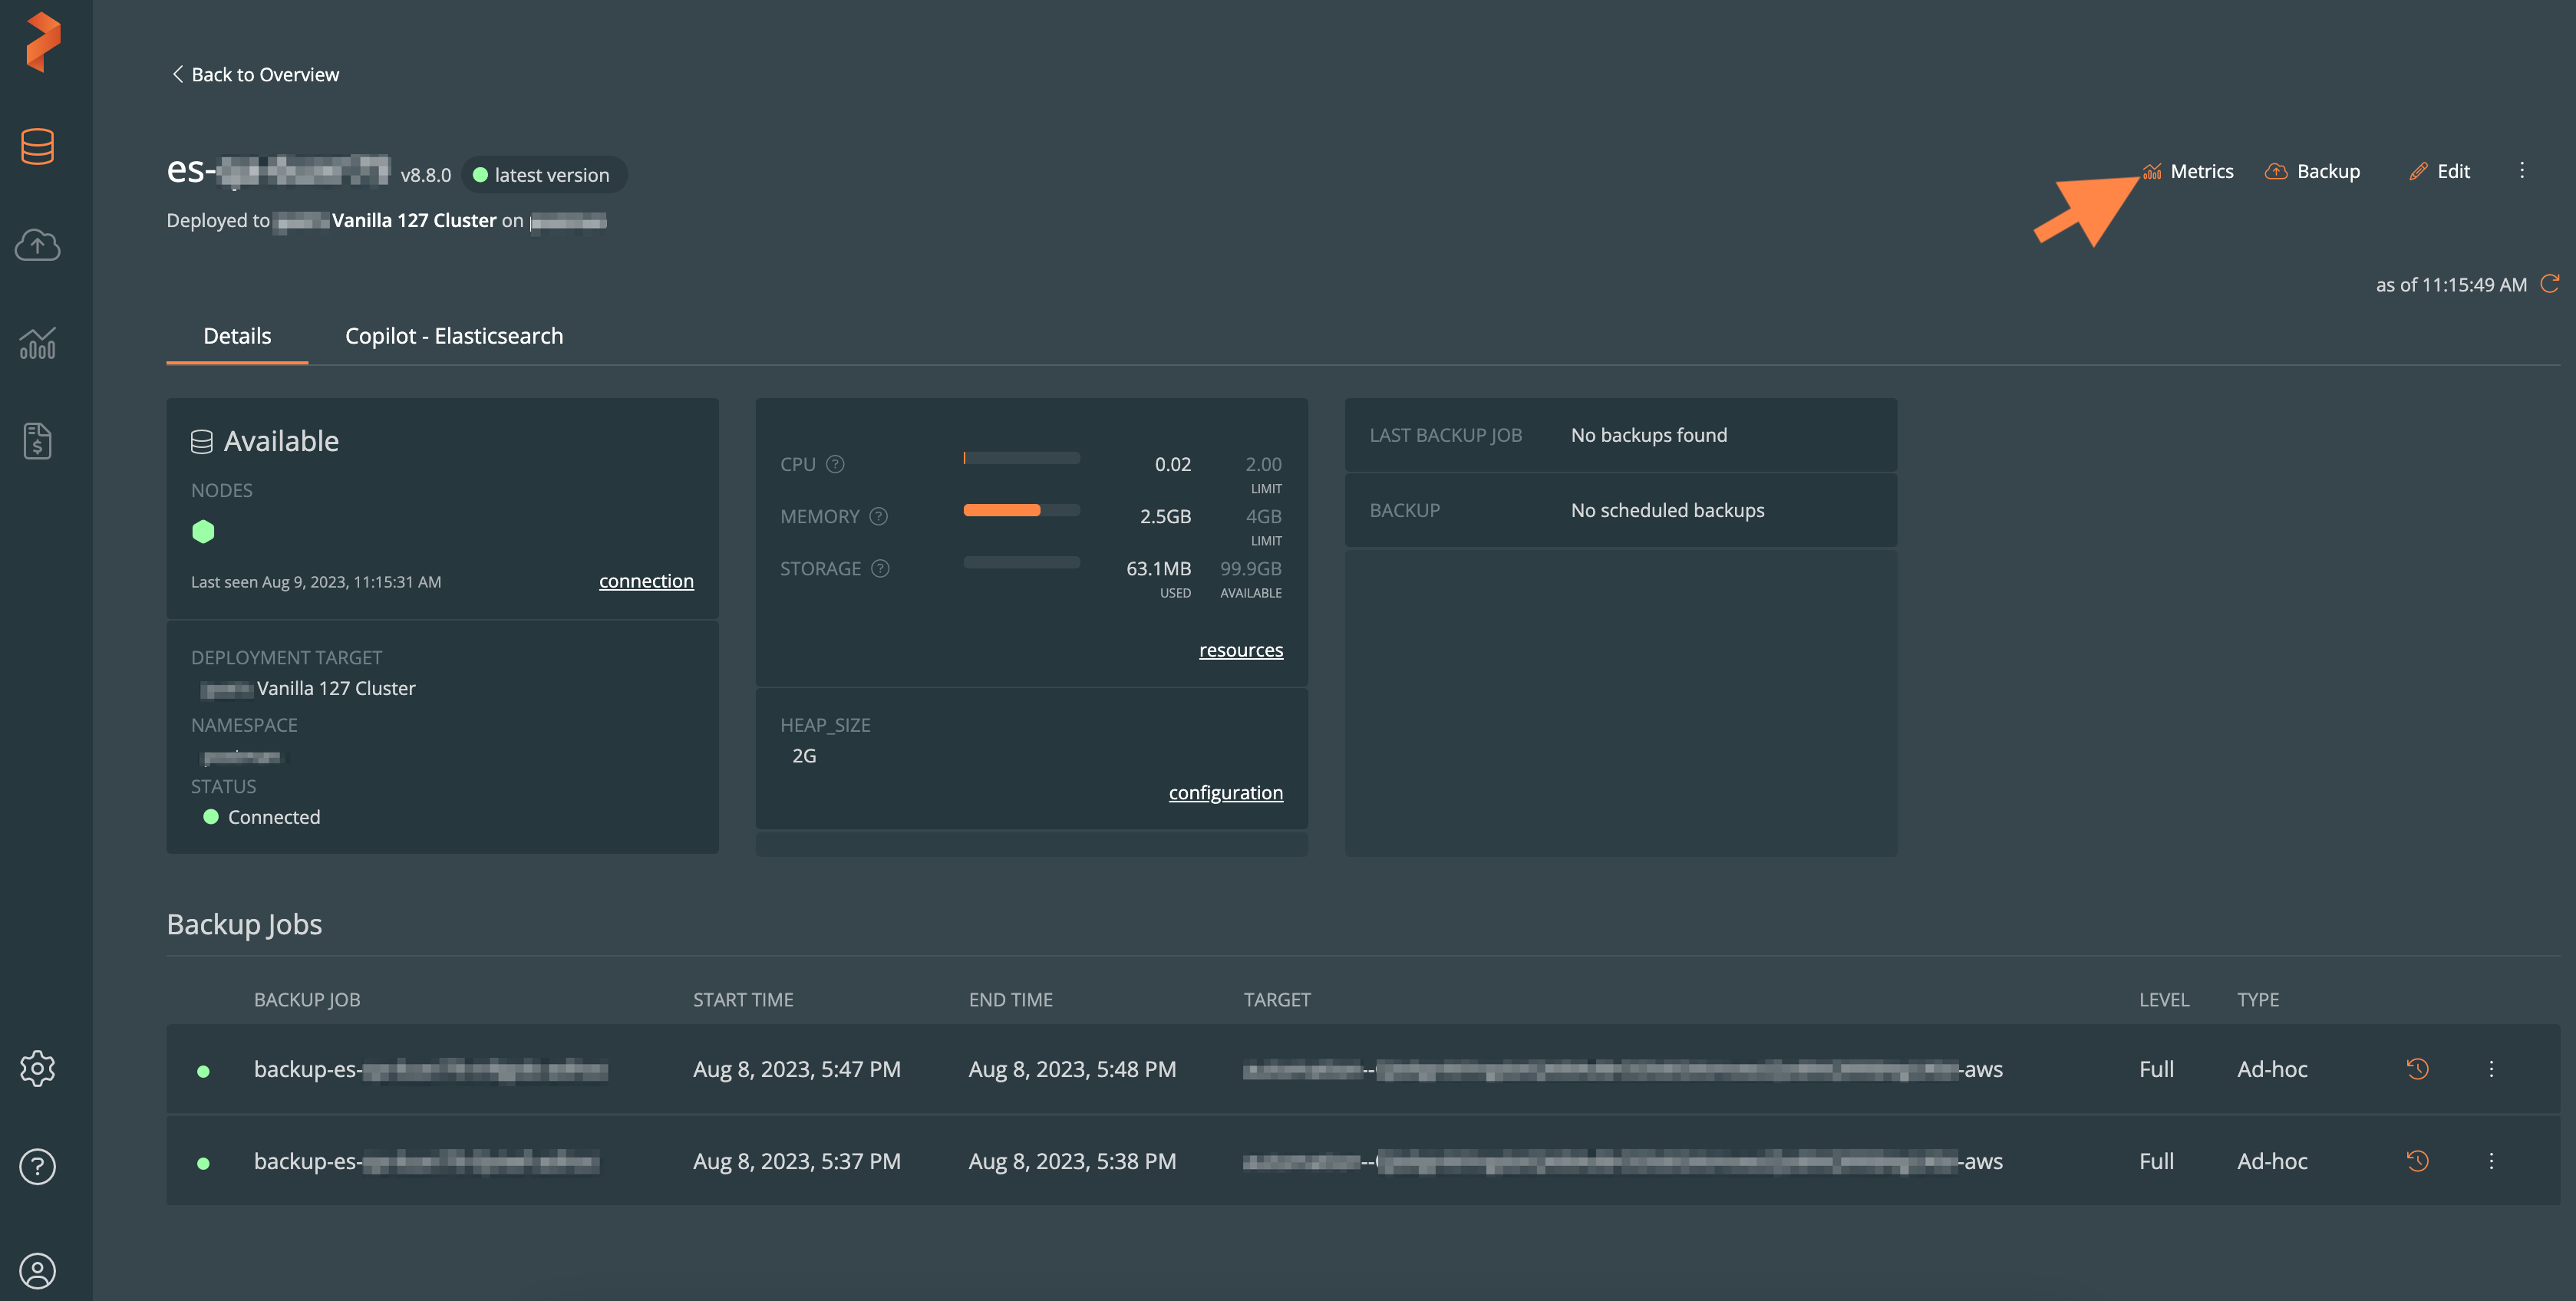
When considering the connection limit for databases, remember that the PDS monitor will use one connection per database in order to collect metrics.
In the metrics dashboard → Timeframe dropdown, you can select a timeline to view the time-based metrics for a deployment.
You can also query the metrics manually.
For more information, refer to the Configure manual metrics collection topic.
Update a data service
In the deployment dashboard, the update available label and the Update button appears when the latest data service version is available for update:
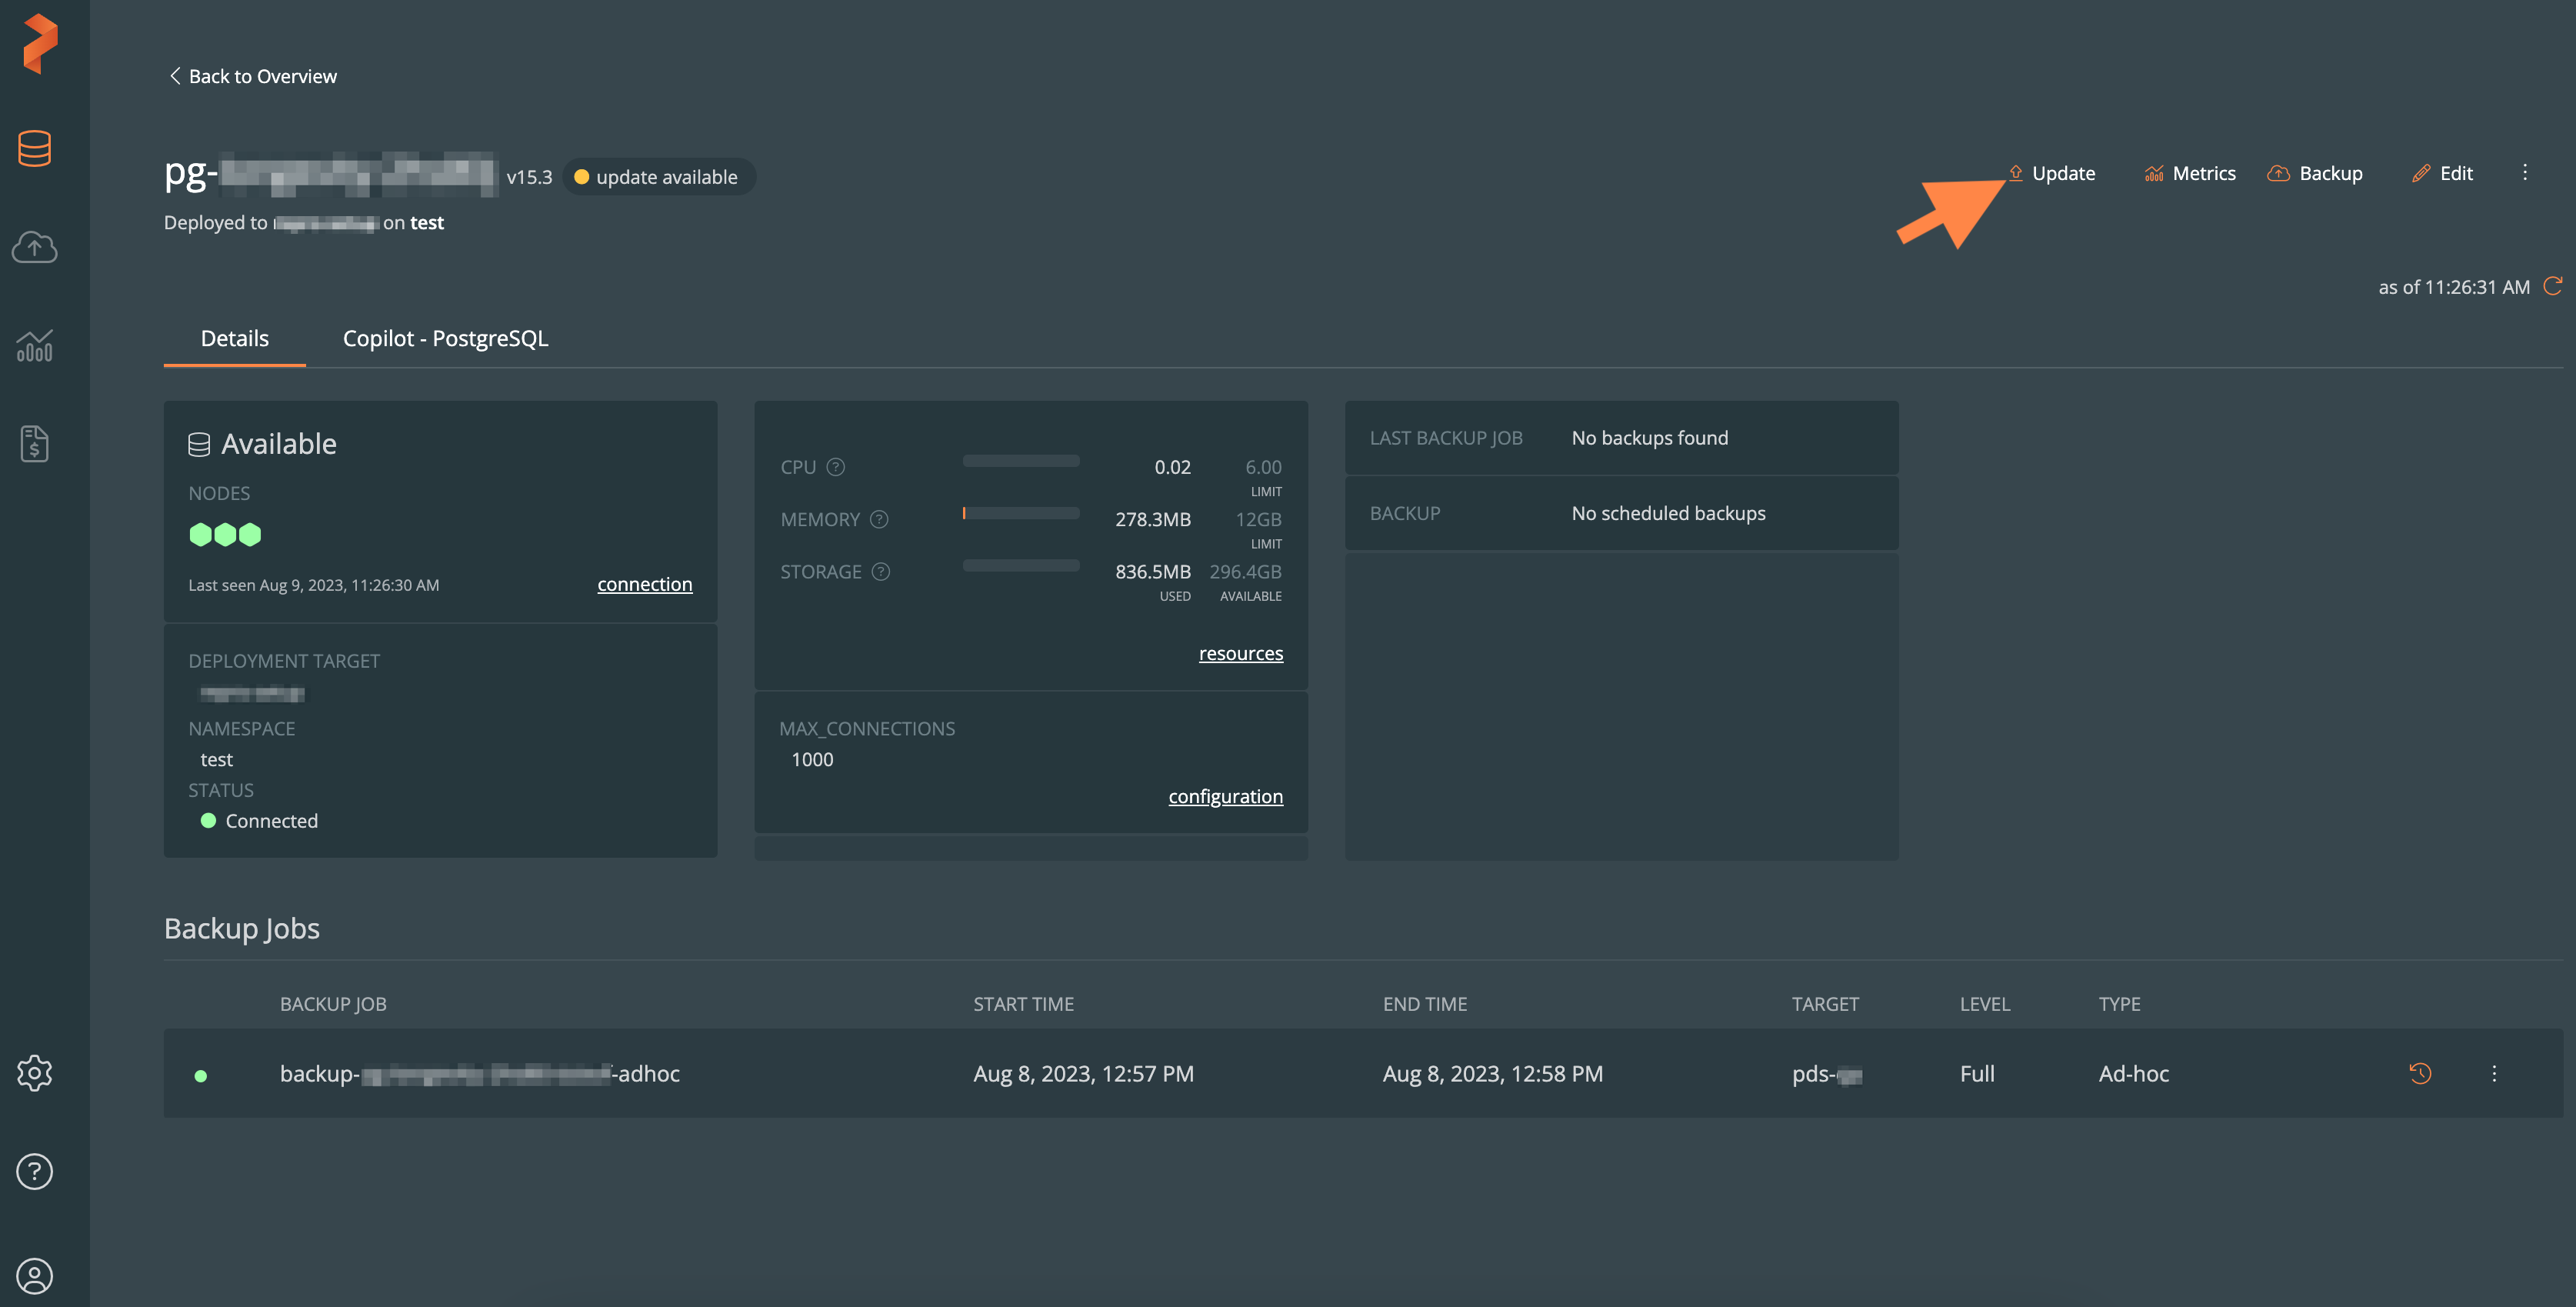
For more information about updating a data service, refer to the Update a data service topic.
Backup a data service
From the deployment dashboard, you can perform an ad-hoc backup of the current data service that you selected.
For more information, refer to the Ad-hoc backup section.
Edit a deployed data service
For more information about managing or editing a deployed data service configuration, refer to the Manage or edit a data service topic.
Delete a deployed data service
For more information about deleting a deployed data service, refer to the Delete a data service topic.
Copilot
Traditionally, end users without technical expertise might find it challenging to interact with databases directly, as it requires knowledge of SQL queries and database structures. On the other hand, database administrators have the expertise to work with databases efficiently but might not always understand the specific needs or queries from end users.
Copilot, in PDS, is an AI-powered tool that aims to bridge the gap between end users and database administrators by enabling a more user-friendly and intuitive approach with databases.
Using Copilot, you can get tips or any information related to the current data service using natural language queries instead of writing complex SQL queries. Copilot understands and interprets natural language inputs and translates them into appropriate database queries. This eliminates the need for end users to have in-depth knowledge of database systems.
Prerequisites
- PDS version 120, since Copilot is available only from this release
Use Copilot
To use Copilot:
In the Data Services Dashboard, select a deployed data service.
In the deployment dashboard, select the Copilot tab.
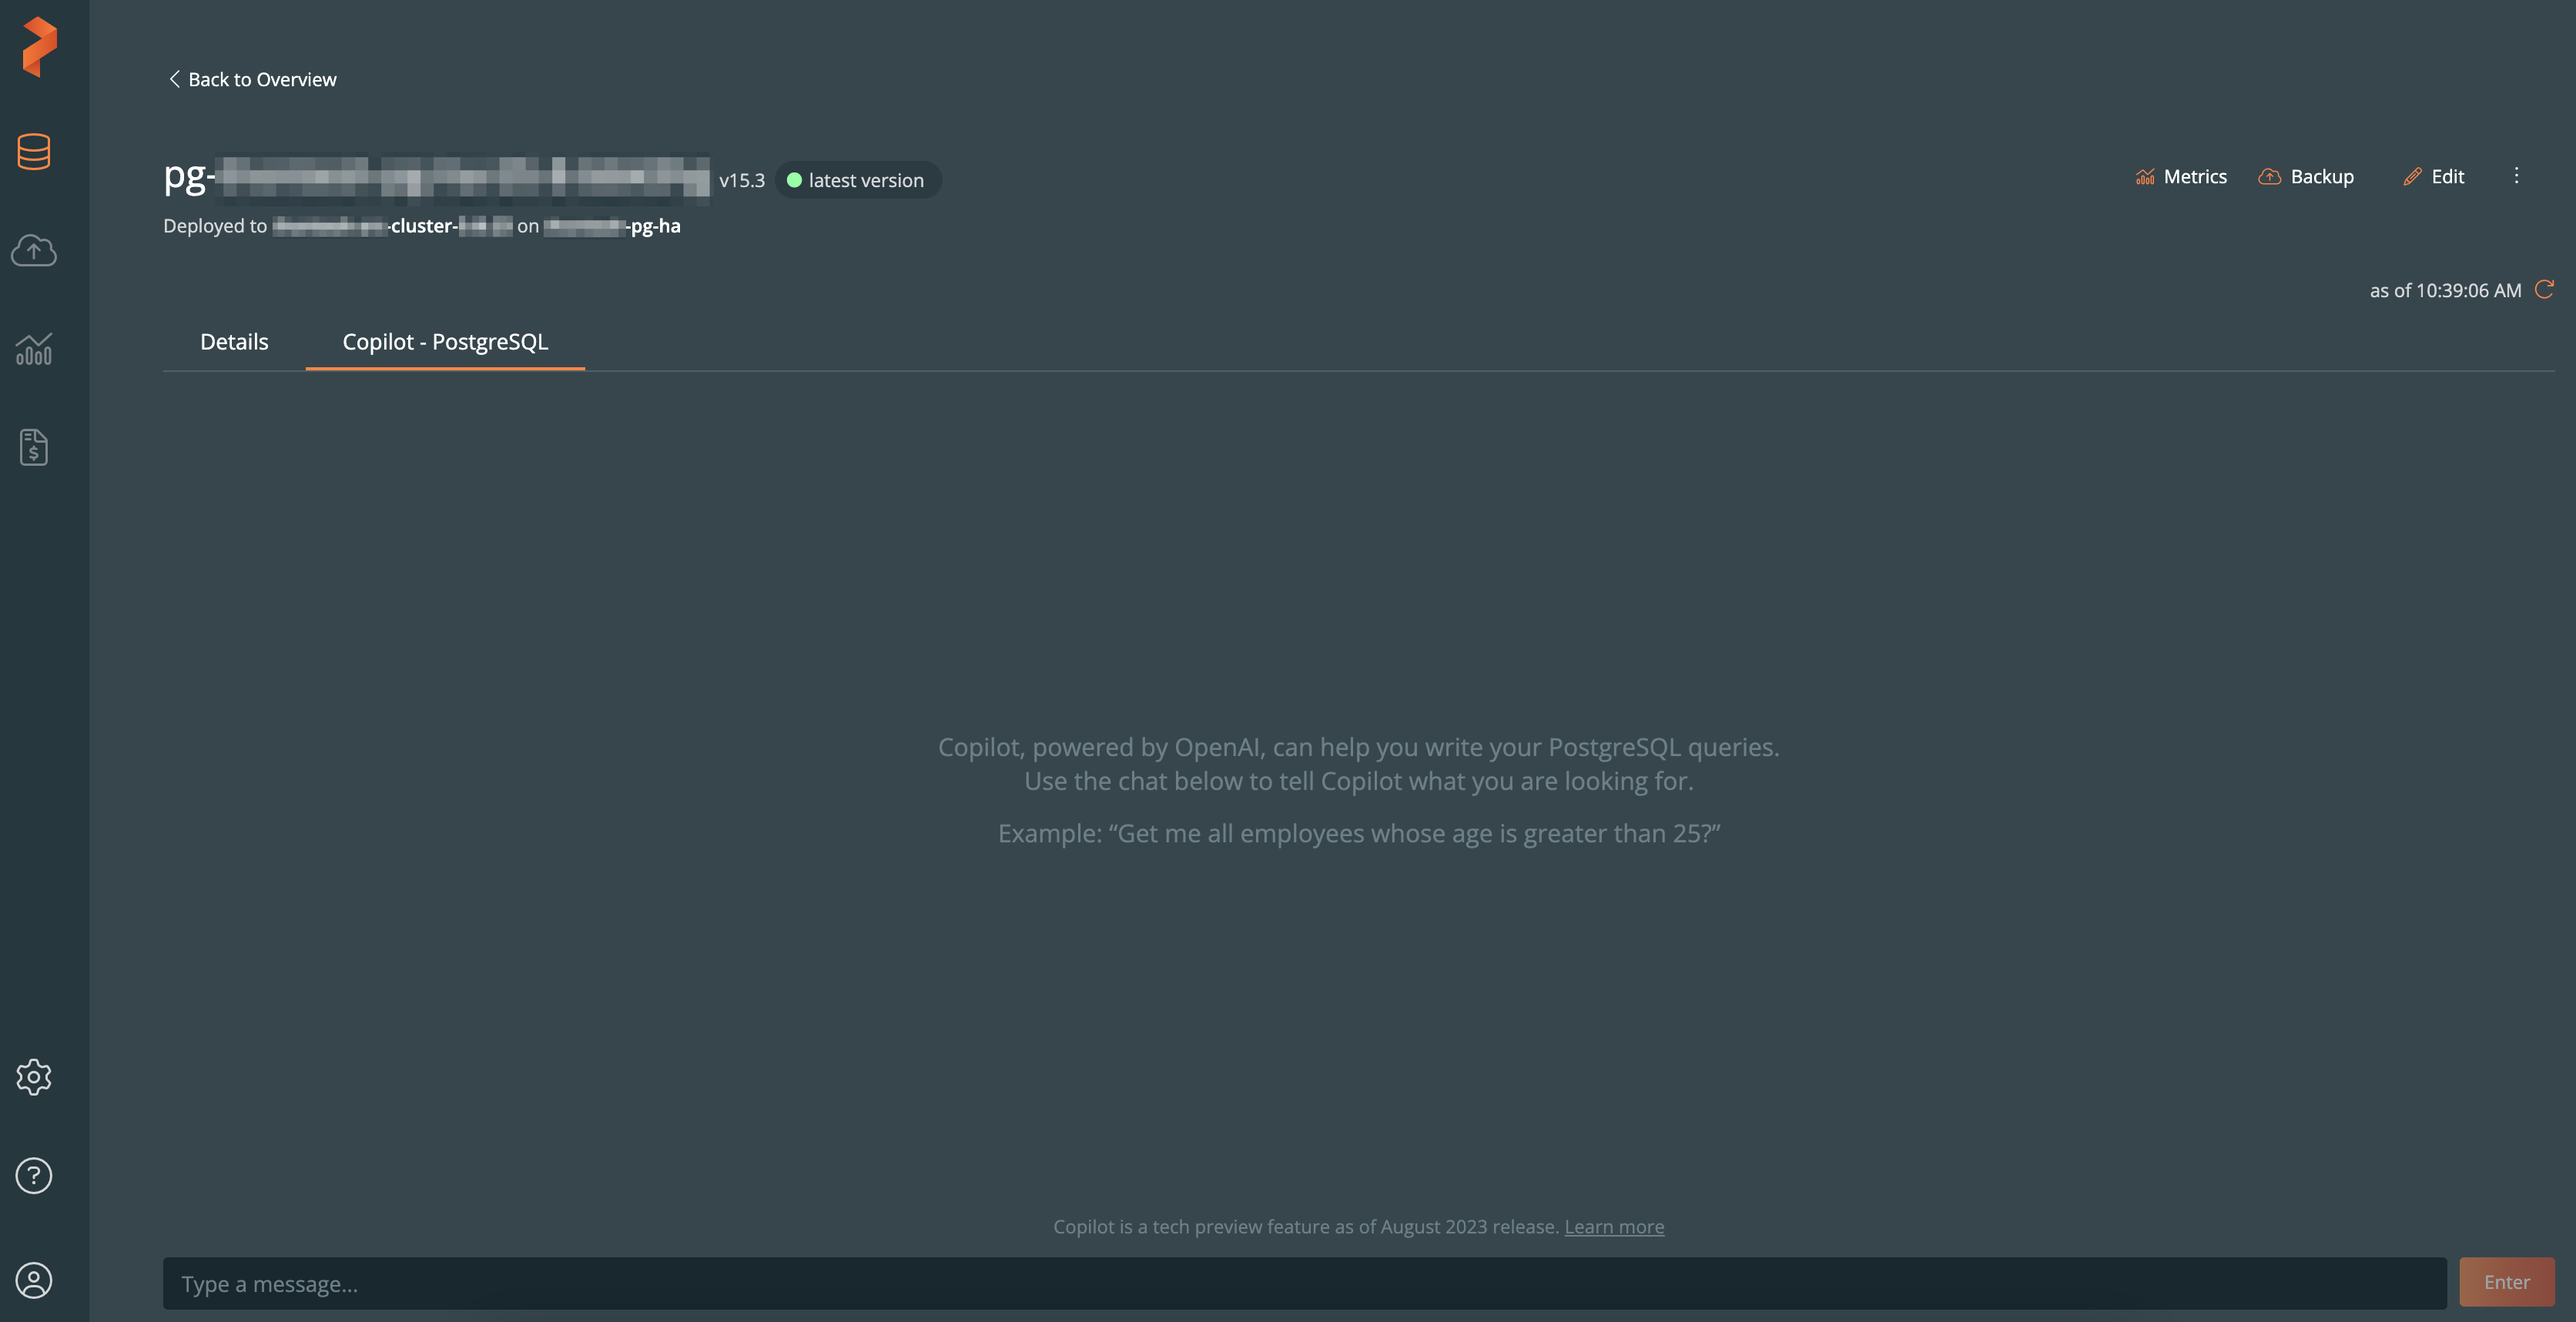
In the text box, at the bottom, enter your query.
noteThe query that you enter is case insensitive.
Select Enter.
Examples to query:
- Conceptual information: “What is RabbitMQ?”
- Code snippet: “t-sql script to kill all processes for a database?”
- Database related: “Script to insert data in batches to improve performance?”
To clear all your previous queries at once, in the Copilot page, select Clear History.
Limitations
Copilot's capabilities are focused on addressing data service-related tasks, such as converting natural language prompts into database queries, providing code snippets for working with data services, and helping with data service configuration and concepts. Copilot provides optimal answers when the queries are related to the following tasks:
- Generating SQL or NoSQL database queries based on natural language prompts.
- Creating code snippets for connecting, manipulating, and performing specific tasks on a data service.
- Handling concepts related to a data service.
- Assisting with the configuration and setup of a data service.
Copilot's response behavior is subject to certain limitations and conditions:
- It may not respond to queries that are unrelated to data service topics or may provide random, irrelevant, or unexpected answers in such cases.
- Short, unclear, or vague queries may also result in limited or ambiguous responses.
- Copilot requires valid and correctly framed data service queries to provide appropriate answers; otherwise, it may not respond accurately.
- The chat prompt used by Copilot lacks context sensitivity, meaning each query is treated independently, and previous queries do not influence its responses.
- Due to the inherent randomness in the underlying OpenAI model, there might be rare instances where a valid query is incorrectly identified as invalid.
- The response length from Copilot is restricted to a maximum of 1024 tokens, which can limit the complexity and detail of its replies.