Install Elasticsearch and Kibana with Portworx on Kubernetes
The following instructions are a step by step guide for deploying the Elasticsearch stack (Elasticsearch, Kibana) with Portworx on Kubernetes.
Elasticsearch is the distributed search and analytics engine that provides a unified data store for solutions built on the Elastic Stack. Refer to the Elasticsearch documentation for more details.
Prerequisites
- A Kubernetes cluster running version 1.19 or newer.
- A Portworx installation on your Kubernetes cluster. For details, see Install Portworx.
Install Elasticsearch
Portworx provides volumes to the Elasticsearch nodes, and it offers a set of storage classes for various use cases. This page uses px-csi-db for Elasticsearch pods, which creates Portworx volumes with three replicas when referenced by a volumeClaimTemplate. Refer to StorageClass Parameters for more information about StorageClass parameters that Portworx supports.
Install and deploy an Elasticsearch cluster
In this section, you will create a three node Elasticsearch cluster and a Kibana instance that are backed by Portworx volumes.
-
Install custom resource definitions:
kubectl create -f https://download.elastic.co/downloads/eck/2.4.0/crds.yamlcustomresourcedefinition.apiextensions.k8s.io/agents.agent.k8s.elastic.co createdcustomresourcedefinition.apiextensions.k8s.io/apmservers.apm.k8s.elastic.co createdcustomresourcedefinition.apiextensions.k8s.io/beats.beat.k8s.elastic.co createdcustomresourcedefinition.apiextensions.k8s.io/elasticmapsservers.maps.k8s.elastic.co createdcustomresourcedefinition.apiextensions.k8s.io/elasticsearches.elasticsearch.k8s.elastic.co createdcustomresourcedefinition.apiextensions.k8s.io/enterprisesearches.enterprisesearch.k8s.elastic.co createdcustomresourcedefinition.apiextensions.k8s.io/kibanas.kibana.k8s.elastic.co created -
Install the Elasticsearch Operator:
kubectl apply -f https://download.elastic.co/downloads/eck/2.4.0/operator.yamlnamespace/elastic-system createdserviceaccount/elastic-operator createdsecret/elastic-webhook-server-cert createdconfigmap/elastic-operator createdclusterrole.rbac.authorization.k8s.io/elastic-operator createdclusterrole.rbac.authorization.k8s.io/elastic-operator-view createdclusterrole.rbac.authorization.k8s.io/elastic-operator-edit createdclusterrolebinding.rbac.authorization.k8s.io/elastic-operator createdservice/elastic-webhook-server createdstatefulset.apps/elastic-operator createdvalidatingwebhookconfiguration.admissionregistration.k8s.io/elastic-webhook.k8s.elastic.co createdVerify the Operator pod status and ensure that it shows as
READY:kubectl -n elastic-system get pods -lcontrol-plane=elastic-operatorNAME READY STATUS RESTARTS AGEelastic-operator-0 1/1 Running 0 2m42 -
Deploy an Elasticsearch cluster. Copy and save the following spec as a YAML file, changing the highlighted values as necessary:
apiVersion: elasticsearch.k8s.elastic.co/v1kind: Elasticsearchmetadata:name: elasticsearchnamespace: elastic-systemspec:version: 8.4.3nodeSets:- name: nodecount: 3config:node.store.allow_mmap: falsevolumeClaimTemplates:- metadata:name: elasticsearch-data # Do not change this name unless you set up a volume mount for the data path.spec:accessModes:- ReadWriteOnceresources:requests:storage: 50Gi # Change the Volumes size as required.storageClassName: px-csi-db # Use appropriate StorageClass name.Run the following command to apply the spec:
kubectl apply -f <filename.yaml>elasticsearch.elasticsearch.k8s.elastic.co/elasticsearch created -
Monitor the Elasticsearch cluster until
HEALTHshows asgreenandPHASEshows asREADY:kubectl -n elastic-system get elasticsearchNAME HEALTH NODES VERSION PHASE AGEelasticsearch green 3 8.4.3 Ready 3m21s -
To check the status of Elasticsearch pods, run the following command:
watch kubectl -n elastic-system get pods --selector='elasticsearch.k8s.elastic.co/cluster-name=elasticsearch'NAME READY STATUS RESTARTS AGEelasticsearch-es-node-0 1/1 Running 0 5melasticsearch-es-node-1 1/1 Running 0 5melasticsearch-es-node-2 1/1 Running 0 5m -
To access the logs for one of the Elasticsearch node pods, run the following command:
kubectl -n elastic-system logs -f elasticsearch-es-node-0
Access your Elasticsearch cluster
Now that you've installed and deployed your Elasticsearch cluster, you're ready to access it. The deployment automatically creates a ClusterIP Service for your cluster. This example uses the service elasticsearch-es-http endpoint to provide access within the Kubernetes cluster.
-
To get the
Nameof the service and theTargetPort, run the following command:kubectl -n elastic-system describe service elasticsearch-es-httpName: <service-name>Namespace: elastic-systemLabels: common.k8s.elastic.co/type=elasticsearchelasticsearch.k8s.elastic.co/cluster-name=elasticsearchAnnotations: <none>Selector: common.k8s.elastic.co/type=elasticsearch,elasticsearch.k8s.elastic.co/cluster-name=elasticsearchType: ClusterIPIP Family Policy: SingleStackIP Families: IPv4IP: 10.104.167.40IPs: 10.104.167.40Port: https 9200/TCPTargetPort: <port>/TCPEndpoints: 192.168.143.10:9200,192.168.147.138:9200,192.168.45.31:9200Session Affinity: NoneEvents: <none> -
Fetch the credentials and save them as an environment variable. A default user named
elasticis automatically created with the password stored in a Kubernetes secret:ESPASSWORD=$(kubectl -n elastic-system get secret elasticsearch-es-elastic-user -o go-template='{{.data.elastic | base64decode}}') -
Access your cluster through the
elasticsearch-es-httpservice endpoint URL:kubectl exec elasticsearch-es-node-0 -n elastic-system -- curl -u "elastic:$ESPASSWORD" -k "https://<service-name>:<port>"{"name" : "elasticsearch-es-node-2","cluster_name" : "elasticsearch","cluster_uuid" : "3CwyPyaMREaIB-Bm8qXQ8Q","version" : {"number" : "8.4.3","build_flavor" : "default","build_type" : "docker","build_hash" : "42f05b9372a9a4a470db3b52817899b99a76ee73","build_date" : "2022-10-04T07:17:24.662462378Z","build_snapshot" : false,"lucene_version" : "9.3.0","minimum_wire_compatibility_version" : "7.17.0","minimum_index_compatibility_version" : "7.0.0"},"tagline" : "You Know, for Search"}
Insert and query a sample index
Insert some sample data and query the index to verify that the cluster is healthy.
-
List Elasticsearch cluster nodes:
kubectl exec elasticsearch-es-node-0 -n elastic-system -- curl -u "elastic:$ESPASSWORD" -k "https://elasticsearch-es-http:9200/_cat/nodes?v"ip heap.percent ram.percent cpu load_1m load_5m load_15m node.role master name192.168.143.10 35 75 1 1.90 1.85 2.42 cdfhilmrstw - elasticsearch-es-node-2192.168.147.138 15 77 1 1.19 1.33 1.52 cdfhilmrstw - elasticsearch-es-node-0192.168.45.31 14 77 1 1.33 1.21 1.59 cdfhilmrstw * elasticsearch-es-node-1 -
Insert a new index:
kubectl exec elasticsearch-es-node-0 -n elastic-system -- curl -XPUT -u "elastic:$ESPASSWORD" -k "https://elasticsearch-es-http:9200/customer?pretty&pretty"{"acknowledged" : true,"shards_acknowledged" : true,"index" : "customer"} -
Query indexes:
kubectl exec elasticsearch-es-node-0 -n elastic-system -- curl -XGET -u "elastic:$ESPASSWORD" -k "https://elasticsearch-es-http:9200/_cat/indices?v&pretty"health status index uuid pri rep docs.count docs.deleted store.size pri.store.sizegreen open customer VX3K32-lQxSfOYl_1dyocQ 1 1 0 0 450b 225b
See result on Portworx volumes
In this section, you will view how the Elasticsearch cluster uses Portworx volumes.
Portworx volumes are created with three replicas for storing indexes and documents for Elasticsearch. This is based on the StorageClass definition.
-
List the Persistent Volumes:
kubectl get pvNAME CAPACITY ACCESS MODES RECLAIM POLICY STATUS CLAIM STORAGECLASS REASON AGEpvc-xxxxxxxx-xxxx-xxxx-xxxx-7f678ca8ba07 50Gi RWO Delete Bound elastic-system/elasticsearch-data-elasticsearch-es-node-2 px-csi-db 12mpvc-xxxxxxxx-xxxx-xxxx-xxxx-d1e920903be2 50Gi RWO Delete Bound elastic-system/elasticsearch-data-elasticsearch-es-node-1 px-csi-db 12mpvc-xxxxxxxx-xxxx-xxxx-xxxx-c7a3e5555f41 50Gi RWO Delete Bound elastic-system/elasticsearch-data-elasticsearch-es-node-0 px-csi-db 12m 45m -
List the Persistent Volume Claims:
kubectl -n elastic-system get pvcNAME STATUS VOLUME CAPACITY ACCESS MODES STORAGECLASS AGEelasticsearch-data-elasticsearch-es-node-0 Bound pvc-xxxxxxxx-xxxx-xxxx-xxxx-c7a3e5555f41 50Gi RWO px-csi-db 14melasticsearch-data-elasticsearch-es-node-1 Bound pvc-xxxxxxxx-xxxx-xxxx-xxxx-d1e920903be2 50Gi RWO px-csi-db 14melasticsearch-data-elasticsearch-es-node-2 Bound pvc-xxxxxxxx-xxxx-xxxx-xxxx-7f678ca8ba07 50Gi RWO px-csi-db 14m -
List the Portworx volumes:
PX_POD=$(kubectl get pods -l name=portworx -n <px-namespace> -o jsonpath='{.items[0].metadata.name}')kubectl exec $PX_POD -n <px-namespace> -- /opt/pwx/bin/pxctl volume listID NAME SIZE HA SHARED ENCRYPTED PROXY-VOLUME IO_PRIORITY STATUS SNAP-ENABLED12772348667588675 pvc-xxxxxxxx-xxxx-xxxx-xxxx-7f678ca8ba07 50 GiB 3 no no no LOW up - attached on 10.13.25.240 no1013728801369127826 pvc-xxxxxxxx-xxxx-xxxx-xxxx-d1e920903be2 50 GiB 3 no no no LOW up - attached on 10.13.25.29 no695731562422595940 pvc-xxxxxxxx-xxxx-xxxx-xxxx-c7a3e5555f41 50 GiB 3 no no no LOW up - attached on 10.13.25.229 no -
Inspect one of the Portworx volumes:
kubectl exec $PX_POD -n <px-namespace> -- /opt/pwx/bin/pxctl volume inspect 12772348667588675Defaulted container "portworx" out of: portworx, csi-node-driver-registrarVolume : 12772348667588675Name : pvc-xxxxxxxx-xxxx-xxxx-xxxx-7f678ca8ba07Size : 50 GiBFormat : ext4HA : 3IO Priority : LOWCreation time : Oct 21 00:34:10 UTC 2022Shared : noStatus : upState : Attached: xxxxxxxx-xxxx-xxxx-xxxx-be0ef0f68452 (10.13.25.240)Last Attached : Oct 21 00:34:34 UTC 2022Device Path : /dev/pxd/pxd12772348667588675Labels : namespace=elastic-system,common.k8s.elastic.co/type=elasticsearch,csi.storage.k8s.io/pvc/name=elasticsearch-data-elasticsearch-es-node-2,csi.storage.k8s.io/pvc/namespace=elastic-system,elasticsearch.k8s.elastic.co/cluster-name=elasticsearch,io_profile=db_remote,csi.storage.k8s.io/pv/name=pvc-xxxxxxxx-xxxx-xxxx-xxxx-7f678ca8ba07,elasticsearch.k8s.elastic.co/statefulset-name=elasticsearch-es-node,pvc=elasticsearch-data-elasticsearch-es-node-2,repl=3...Replica sets on nodes:Set 0Node : 10.13.25.43 (Pool xxxxxxxx-xxxx-xxxx-xxxx-9e181a790081 )Node : 10.13.25.229 (Pool xxxxxxxx-xxxx-xxxx-xxxx-64664cff557d )Node : 10.13.25.240 (Pool xxxxxxxx-xxxx-xxxx-xxxx-1cde7b129211 )Replication Status : UpVolume consumers :- Name : elasticsearch-es-node-2 (xxxxxxxx-xxxx-xxxx-xxxx-fe7d83266b52) (Pod)Namespace : elastic-systemRunning on : portworx-demo-node1Controlled by : elasticsearch-es-node (StatefulSet
Install Kibana
To deploy your Kibana instance, perform the following steps.
-
Specify a Kibana instance and associate it with your Elasticsearch cluster. Copy the following spec and save it as a YAML file:
apiVersion: kibana.k8s.elastic.co/v1kind: Kibanametadata:name: elasticsearchnamespace: elastic-systemspec:version: 8.4.3count: 1elasticsearchRef:name: elasticsearchApply the spec with the following command:
kubectl apply -f <filename.yaml>kibana.kibana.k8s.elastic.co/elasticsearch created -
Monitor the Kibana health and creation progress. Similar to Elasticsearch, you can retrieve details about Kibana instances:
kubectl -n elastic-system get kibanaNAME HEALTH NODES VERSION AGEquickstart green 1 8.4.3 19h -
Watch the associated Kibana pod and wait for
READYto show1/1andSTATUSto showRunning:watch kubectl -n elastic-system get pod --selector='kibana.k8s.elastic.co/name=elasticsearch'NAME READY STATUS RESTARTS AGEelasticsearch-kb-5f9797849f-fwk2z 1/1 Running 0 4m7s -
To see a description of the Kibana service that is automatically created for your cluster, run the following command:
kubectl -n elastic-system describe svc elasticsearch-kb-httpName: elasticsearch-kb-httpNamespace: elastic-systemLabels: common.k8s.elastic.co/type=kibanakibana.k8s.elastic.co/name=elasticsearchAnnotations: <none>Selector: common.k8s.elastic.co/type=kibana,kibana.k8s.elastic.co/name=elasticsearchType: ClusterIPIP Family Policy: SingleStackIP Families: IPv4IP: 10.96.169.11IPs: 10.96.169.11Port: https 5601/TCPTargetPort: 5601/TCPEndpoints: 192.168.229.144:5601Session Affinity: NoneEvents: <none> -
Use the following command to access Kibana from your local workstation:
kubectl -n elastic-system port-forward service/elasticsearch-kb-http 5601 -
Open
https://localhost:5601in your browser. Your browser will show a warning because the self-signed certificate configured by default is not verified by a known certificate authority and is not trusted by your browser. You can temporarily acknowledge the warning for the purposes of this quickstart, but it is highly recommended that you configure valid certificates for any production deployments. -
Log in as the
elasticuser. Get the password with the following command:kubectl -n elastic-system get secret elasticsearch-es-elastic-user -o go-template='{{.data.elastic | base64decode}}';echo
Verify Kibana Installation
Insert data into Elasticsearch and verify that Kibana is able to search for the data in Elasticsearch. This will help create dashboards and visualizations.
-
Download a sample file named
accounts.json:kubectl exec elasticsearch-es-node-0 -n elastic-system -- curl -k -XGET "https://docs.portworx.com/portworx-enterprise/samples/k8s/efk/accounts.json?raw=true" -o accounts.json -
Insert the data into Elasticsearch:
kubectl exec elasticsearch-es-node-0 -n elastic-system -- curl -H "Content-Type:application/json" -XPUT -u "elastic:$ESPASSWORD" -k "https://elasticsearch-es-http:9200/bank/_bulk?pretty&refresh" --data-binary "@accounts.json" -
To retrieve high-level information about each index in your Elasticsearch cluster, enter the following command:
kubectl exec elasticsearch-es-node-0 -n elastic-system -- curl -XGET -u "elastic:$ESPASSWORD" -k "https://elasticsearch-es-http:9200/_cat/indices?v&pretty"health status index uuid pri rep docs.count docs.deleted store.size pri.store.sizegreen open bank rjUKwlOKRdeSQmH_29bR4Q 1 1 1000 0 754.6kb 383.9kbgreen open customer VX3K32-lQxSfOYl_1dyocQ 1 1 0 0 450b 225bOnce you have run the above command you should see
bankandcustomerindexes in your Elasticsearch cluster. Search for the indexes through your Kibana dashboard. -
Log in to the Kibana dashboard using the instructions from the previous section.
-
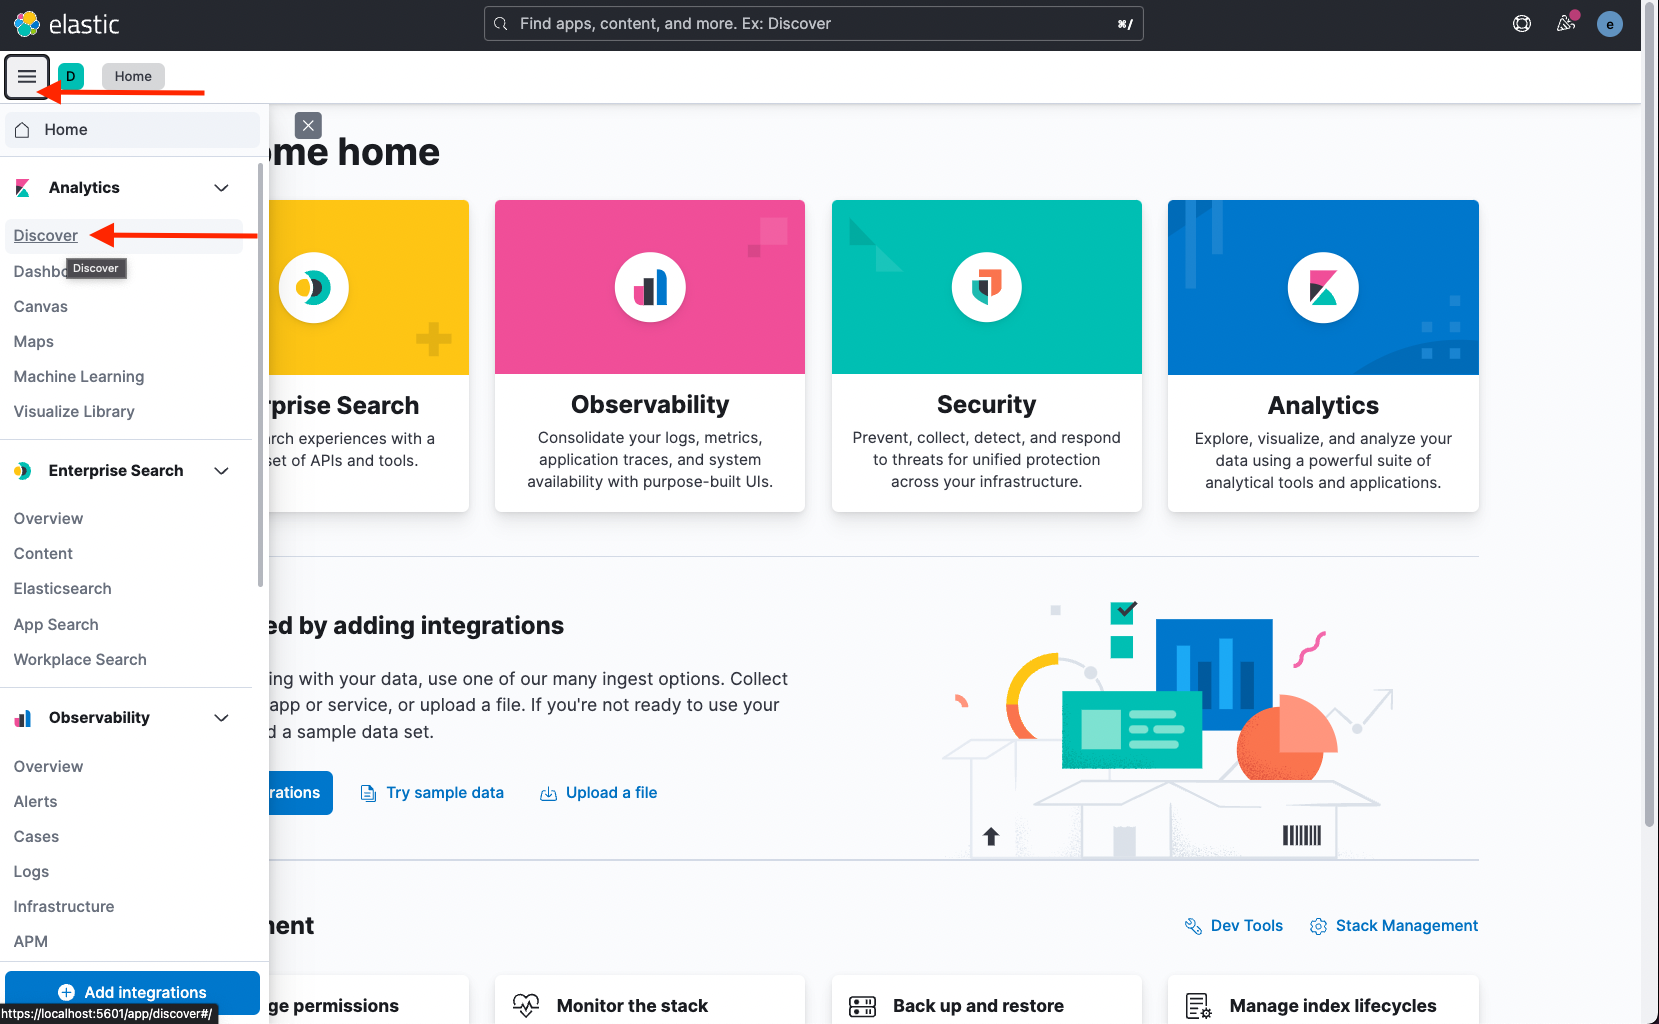
Open the left menu and click Discover.
-
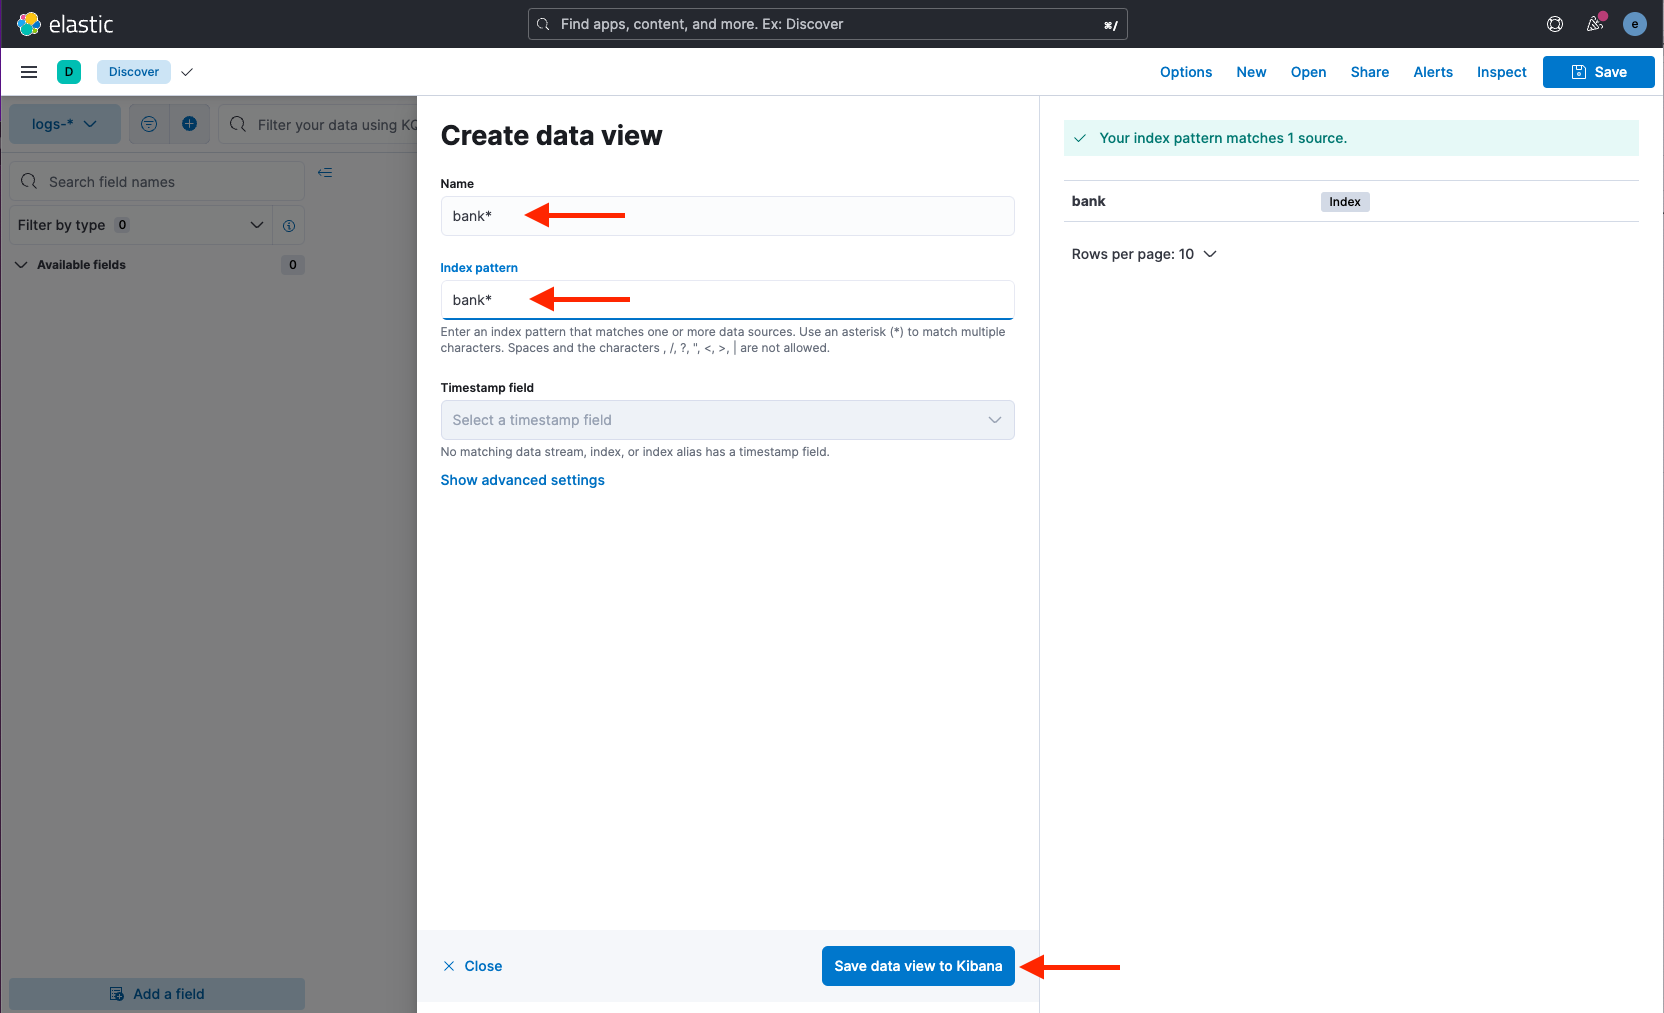
Click Create data view to add an index:

-
Provide the index pattern bank* and click Save data view to Kibana:
-
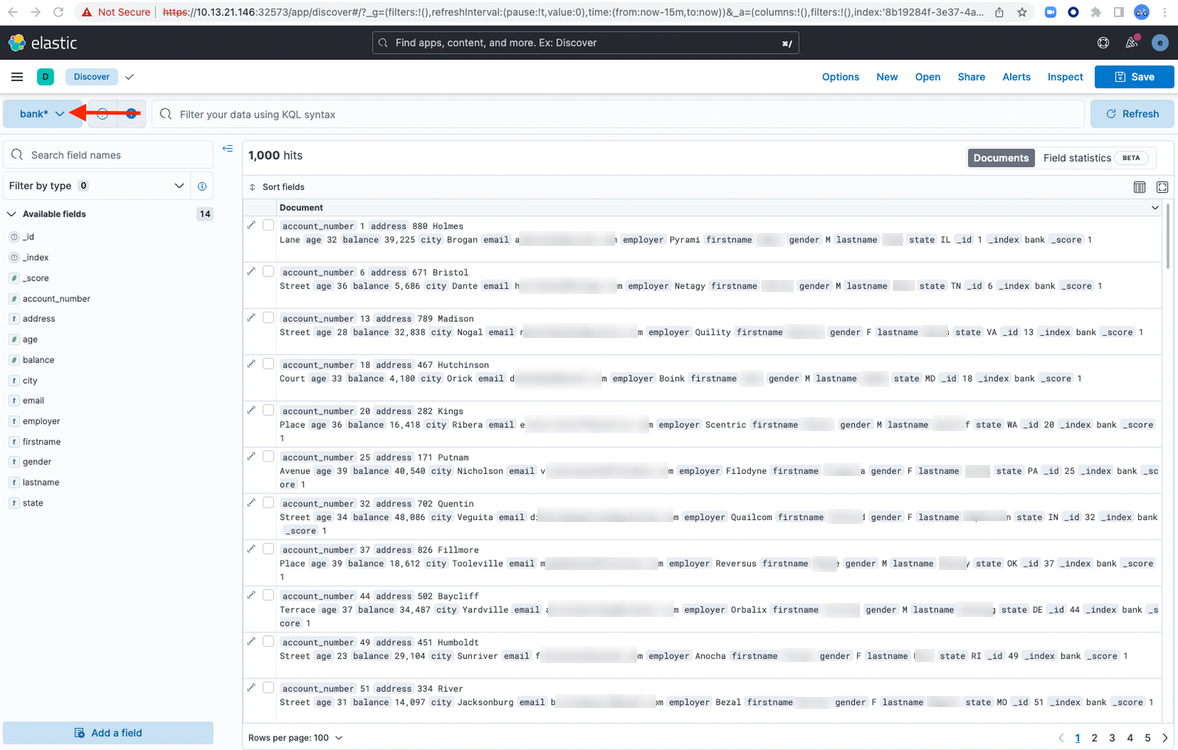
Select the index bank* from the data view:
Discussion Forum
If you have more questions about this application, please head over to our discussion forum and feel free to ask more questions.