Portworx integration with Prometheus
Support for Portworx on the following orchestrators will be deprecated:
- Docker Swarm and Docker Standalone
- Nomad
For installation instructions on other platforms, refer to the Platform guides section.
This document presents the non-Kubernetes method of monitoring your Portworx cluster with Prometheus. Please refer to the Prometheus and Grafana page if you are running Portworx on Kubernetes.
Portworx storage and network stats can easily be integrated with prometheus or similar applications. These stats are exported at port 9001; your application can poll http://<IP_ADDRESS>:9001/metrics to get their runtime values.
Integration with Prometheus
Step 1: Configuring Prometheus to watch a Portworx node
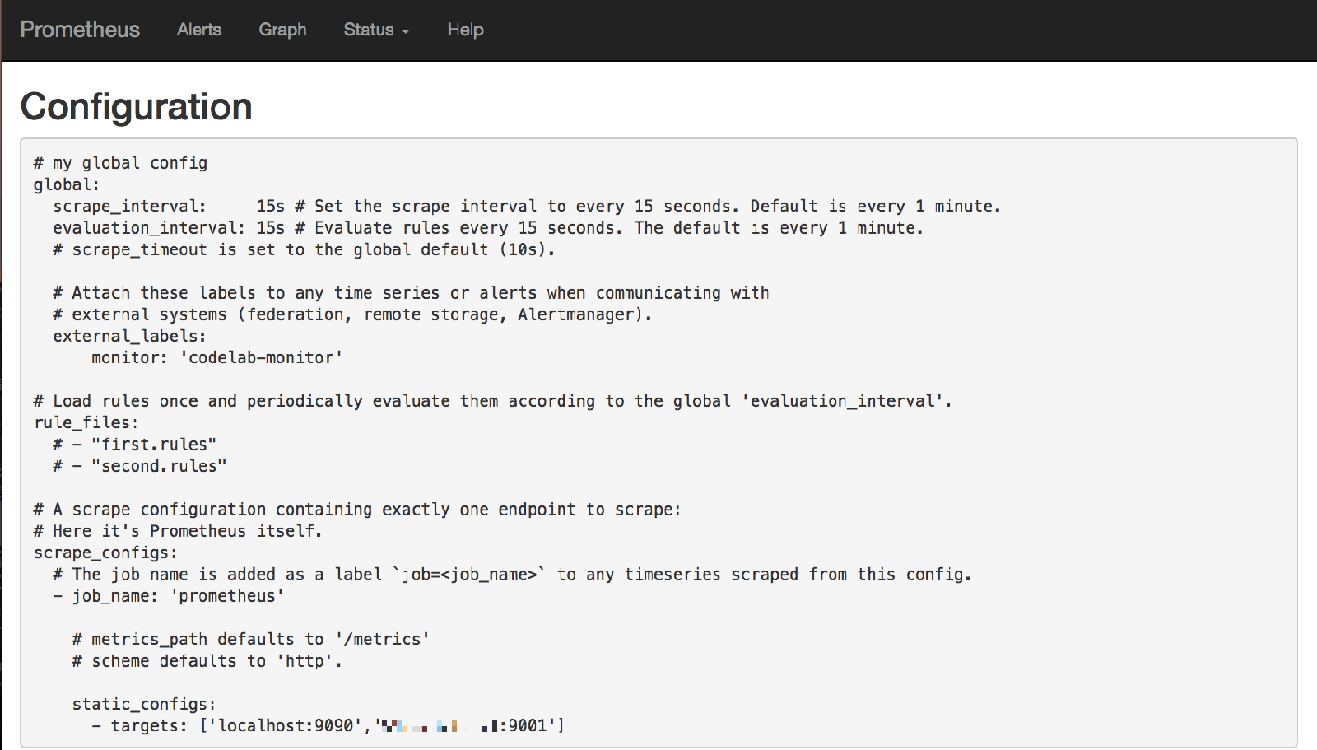
Add your Portworx node as a target in Prometheus config file:

In the example above, our node has IP address of X.X.X.1, so Prometheus is watching X.X.X.1:9001 as its target. This can be any node in the Portworx cluster.
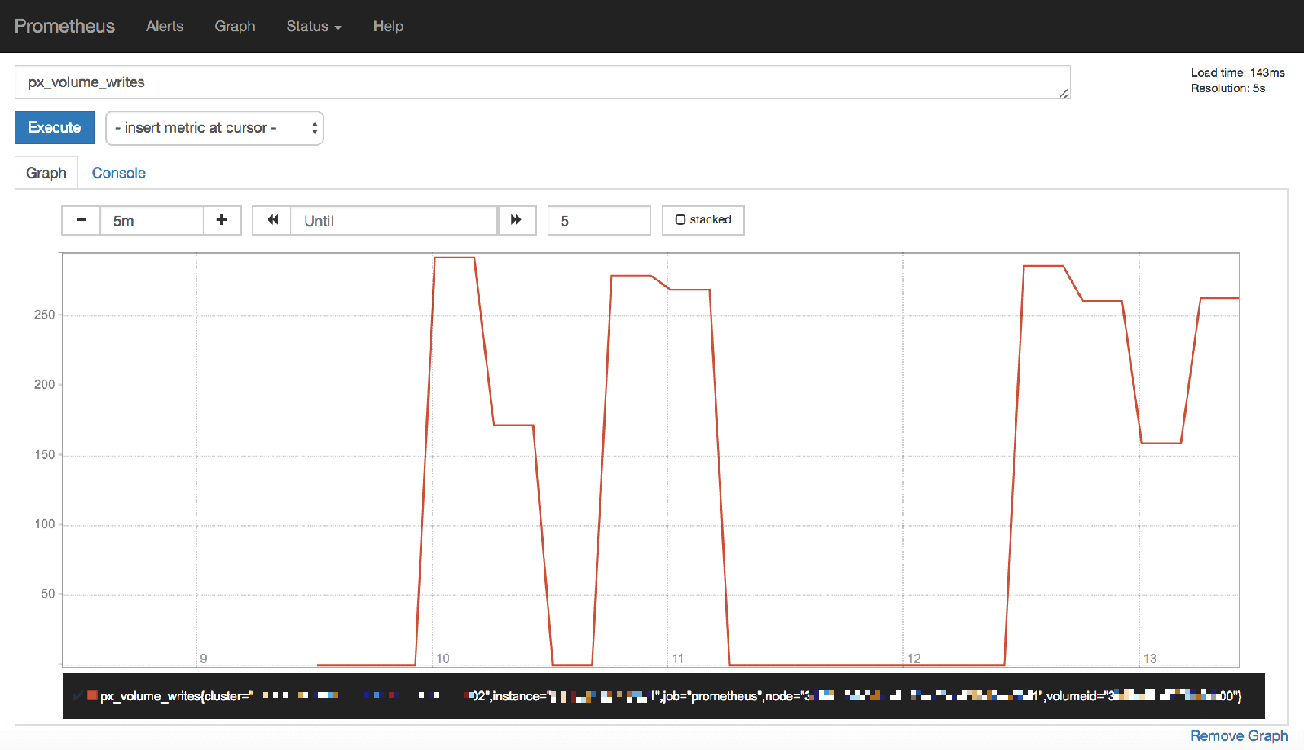
Step 2: Portworx metrics to watch and building graphs with Prometheus
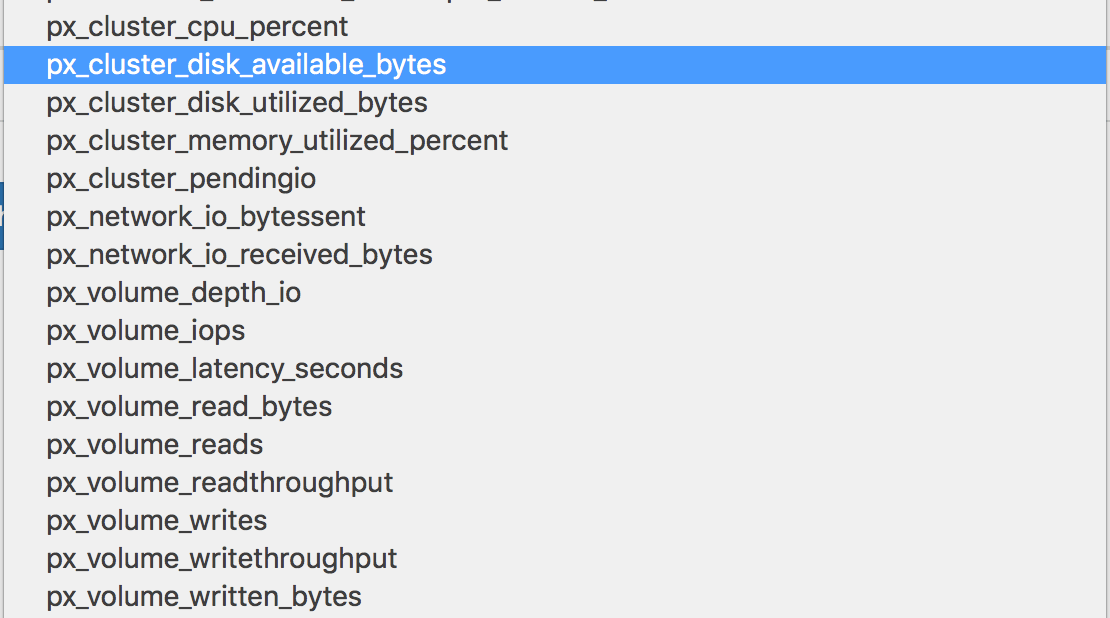
Once Prometheus starts watching your Portworx node, you will be able to see new Portworx related metrics added to Prometheus.

You can now build graphs:

You can also see the stats by running the following curl command:
curl http://<hostname-or-ip>:9001/metrics
Related topics
For information on the available Portworx metrics, refer to the Portworx metrics for monitoring reference.